Figures & data
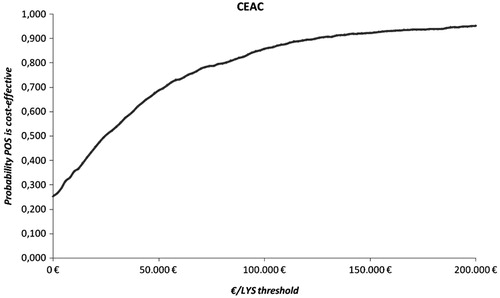
Figure 1. The study model.
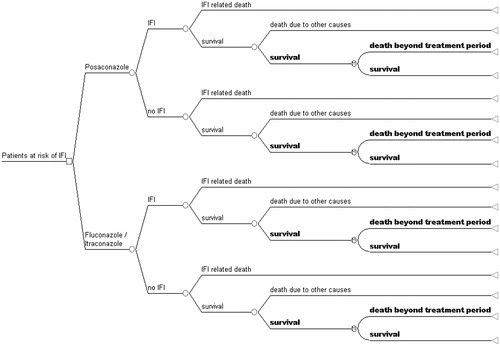
Table 1. Base case parameters.
Table 2. Variables varied in the sensitivity analysis and parameters of distributions.
Table 3. Cost-effectiveness results of posaconazole vs standard azole treatment for a lifetime horizon.
Table 4. Cost-effectiveness results of posaconazole vs standard azole treatment for the 100 first days of treatment.
Figure 2. Probabilistic sensitivity analysis scatterplot for posaconazole vs standard azole treatment. Trendline represents the €30,000/LYS threshold, points represent ICERs. Points that fall in the SW quadrant represent ‘dominant’ ICERs (posaconazole more effective and less costly than alternatives). Points that fall in the SW quadrant plus those that fall under the trendline represent cost-effective ICERs.
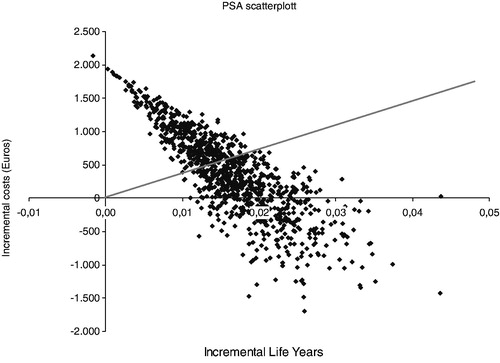
Figure 3. Cost-effectiveness acceptability curve for posaconazole vs standard azole treatment.