Figures & data
Figure 1. Model schematic. CIS, clinically isolated syndrome; Tx, treatment; EDSS, expanded disability status scale; MS, multiple sclerosis.
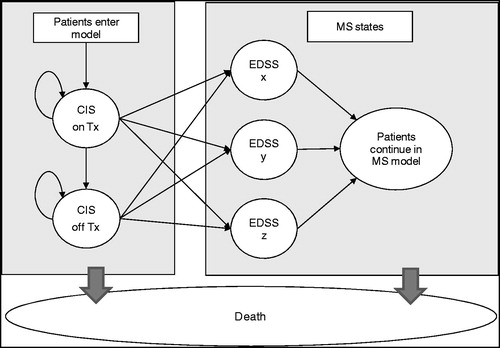
Table 1. Heath state costs and utility values by EDSS score.
Figure 2. Estimated time to MS conversion: treatment vs no treatment.
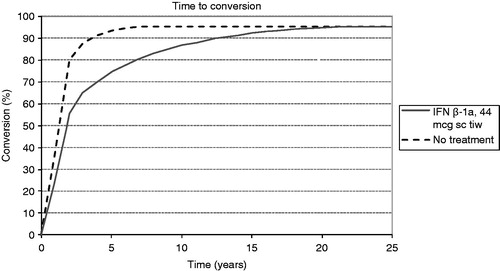
Table 2. Cost-effectiveness of sc IFN beta-1a tiw vs no treatment.
Figure 3. One-way sensitivity analysis tornado diagram. Note, this figure illustrates the variation from the base-case net monetary benefit (535,118 SEK) found when individual model parameters were changed. Values in parentheses represent the lower, base-case, and upper values tested in the sensitivity analysis. EDSS, Expanded Disability Status Scale; HR, hazard ratio; IFN, interferon; sc, subcutaneously; SPMS, secondary progressive MS; tiw, 3-times weekly. For ‘McDonald progression approach’, 1 = constant probability of conversion to MS, 2 = parametric extrapolation used in base case. For ‘Utility dataset in use’, 1 = UK dataset26, 2 = Swedish dataset used in base case4.
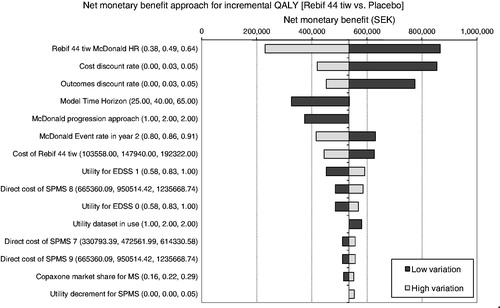
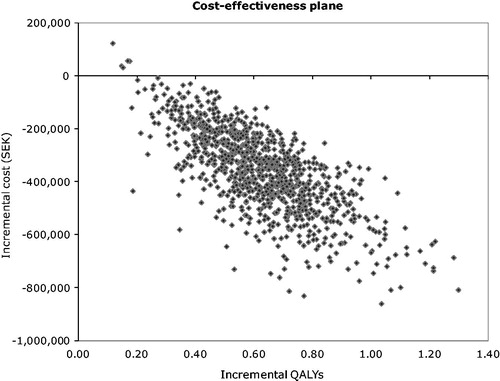
Figure 4. Cost-effectiveness plane showing incremental cost vs incremental QALYs for each PSA iteration.