2,256
Views
43
CrossRef citations to date
0
Altmetric
Original Articles

The cost-effectiveness of onabotulinumtoxinA for the prophylaxis of headache in adults with chronic migraine in the UK

, , , , , , & show all
Pages 877-887 | Accepted 19 Apr 2013, Published online: 22 May 2013

Figures & data

Figure 1. Markov-state transition diagram.

Figure 1. Markov-state transition diagram.

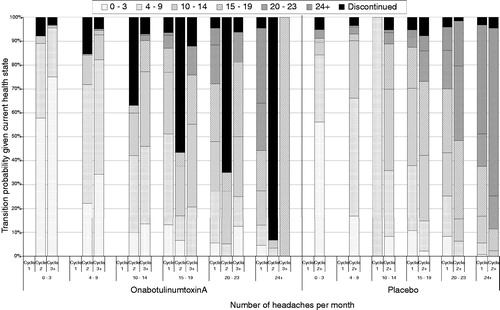
Figure 2. Visual representation of transition probabilities: 30% negative stopping rule.

Figure 2. Visual representation of transition probabilities: 30% negative stopping rule.

Table 1. Utility values for onabotulinumtoxinA and placebo across health states and patient populations.

Table 2. Resource use and costs by health state (per 12-week model cycle).

Table 3. Base case results—disaggregated costs and QALYs.

Table 4. Base case results and sensitivity analyses.

Figure 3. Patient distribution over 20-year time horizon, onabotulinumtoxinA and placebo. HA, headache.
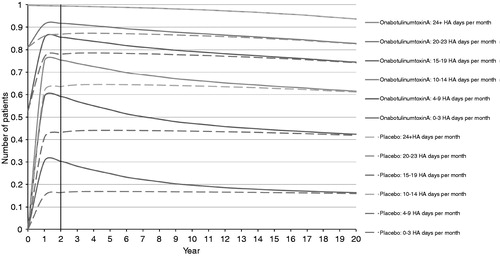
Figure 3. Patient distribution over 20-year time horizon, onabotulinumtoxinA and placebo. HA, headache.

Figure 4. Probabilistic sensitivity analysis: cost-effectiveness plane, 5000 simulations. QALY, Quality--adjusted life year.
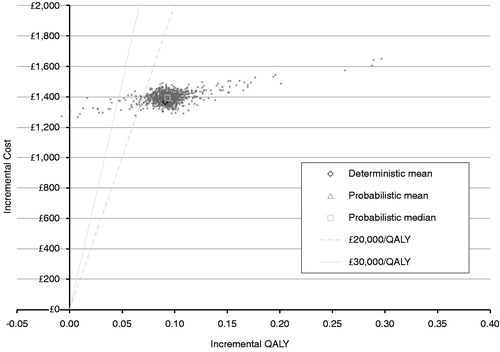
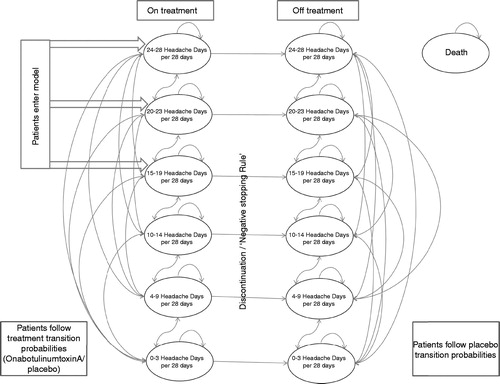
Figure 4. Probabilistic sensitivity analysis: cost-effectiveness plane, 5000 simulations. QALY, Quality--adjusted life year.
Reprints and Corporate Permissions

Please note: Selecting permissions does not provide access to the full text of the article, please see our help page How do I view content?

To request a reprint or corporate permissions for this article, please click on the relevant link below:

Academic Permissions

Please note: Selecting permissions does not provide access to the full text of the article, please see our help page How do I view content?

Obtain permissions instantly via Rightslink by clicking on the button below:

If you are unable to obtain permissions via Rightslink, please complete and submit this Permissions form. For more information, please visit our Permissions help page.