Figures & data
Figure 1. Model structure.
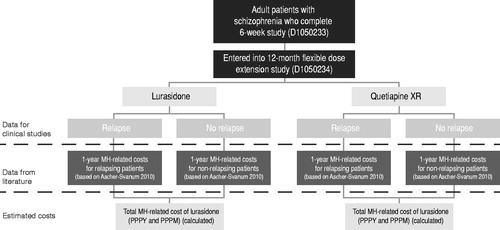
Table 1. Observed relapse-related hospitalization rates and relapse ratesCitation15.
Table 2. Cost inputs in 2011 USDCitation8,Citation17.
Figure 2. Mental healthcare-related estimated direct costs per patient per year (all subjects/relapse-related hospitalization rates). * Using relapse-related hospitalization rates to estimate costs of psychiatric hospitalizations. ACT, assertive community treatment; error bars represent the 95% confidence interval for each value.
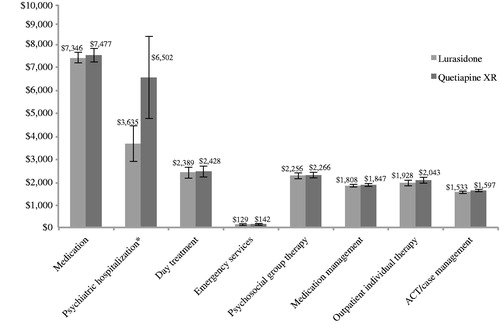
Figure 3. Mental healthcare-related estimated direct costs per patient per year (clinical responders/relapse-related hospitalization rates). * Using relapse-related hospitalization rates to estimate costs of psychiatric hospitalizations. ACT, assertive community treatment; error bars represent the 95% confidence interval for each value.
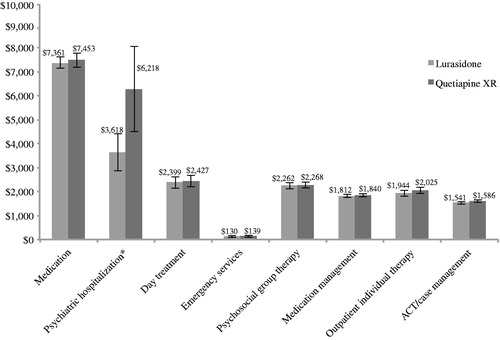
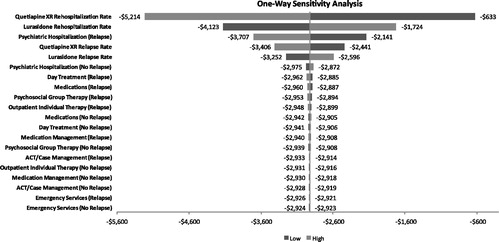
Figure 4. Univariate sensitivity analysis (all subjects/relapse-related hospitalization rates) using relapse-related hospitalization rates to estimate costs of psychiatric hospitalizations. Note, the output of the one-way sensitivity analysis is depicted as a tornado diagram, in which the width of the arms represents the influence of that parameter on the model results, while holding all other parameters constant.
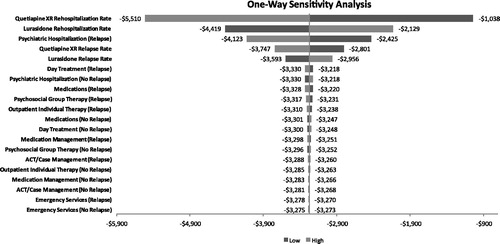
Figure 5. Univariate sensitivity analysis (clinical responders/relapse-related hospitalization rates) using relapse-related hospitalization rates to estimate costs of psychiatric hospitalizations. Note, the output of the one-way sensitivity analysis is depicted as a tornado diagram, in which the width of the arms represents the influence of that parameter on the model results, while holding all other parameters constant.