Figures & data
Figure 1. Patient selection. The number and percentage of patients excluded by each sample selection criteria.
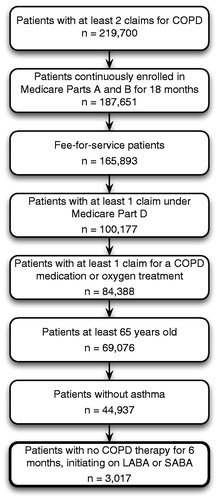
Figure 2. Study design. Patients filled their first SABA or LABA prescription on the index data. Covariates were calculated during the baseline and treatment evaluation period. The outcome variables were assessed during the 6-month follow-up period.
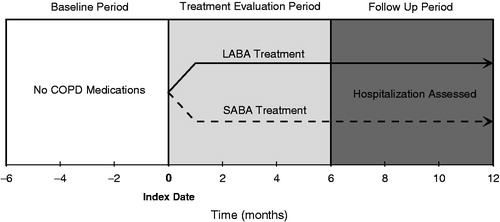
Table 1. Patient characteristics during the baseline and treatment evaluation periods.
Figure 3. Kaplan-Meier curve for time to all-cause hospitalization. After correcting for background characteristics, the LABA treated patients had a significantly lower risk of hospitalization (HR = 0.74, p = 0.002).
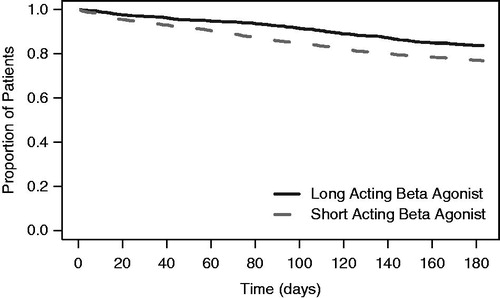
Table 2. Results of Cox proportional hazards model for time to hospitalization.