Figures & data
Figure 1. Markov decision analytic model simulating the history of a cohort of patients with high risk of gastrointestinal stromal tumour recurrence. The figure depicts heath states during adjuvant imatinib therapy and for two possible treatment lines after tumour recurrence. The model structure reflects the clinical recommendations of the European Society for Medical Oncology, the clinical practice in the Netherlands, and has been validated by oncologists. At baseline, patients differ in terms of the length of adjuvant imatinib therapy (1 vs 3 years) that they are assigned to receive (A1 health state). No further differences in patients were assumed.
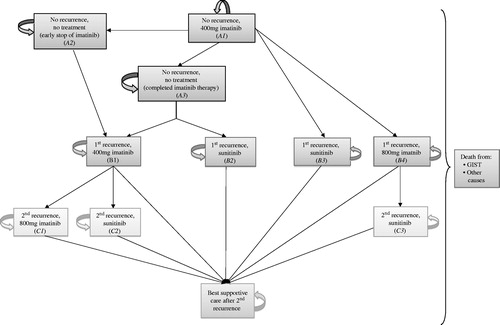
Figure 2. Observed and extrapolated recurrence-free survival in patients with high risk of tumour recurrence.
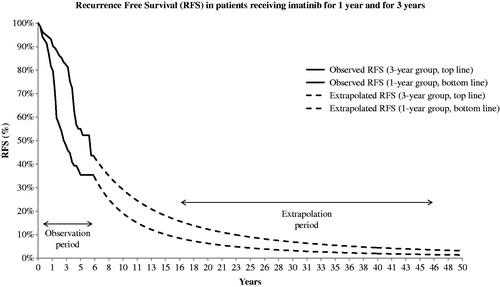
Table 1. Main clinical and economic input values (mean, standard error, the distribution used in the probabilistic sensitivity analysis and the source of input data).
Figure 3. Predicted overall survival for patients receiving 1-year and 3-year adjuvant imatinib therapy.
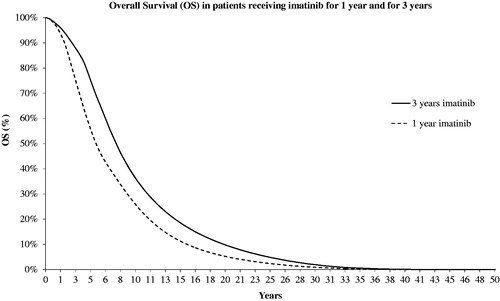
Table 2. Overall survival, quality-adjusted life years (undiscounted and discounted with 1.5%) and costs per patient (undiscounted and discounted with 4%), base case analysis.
Table 3. Results of the sensitivity analyses, incremental costs, outcomes, and cost-effectiveness ratios.
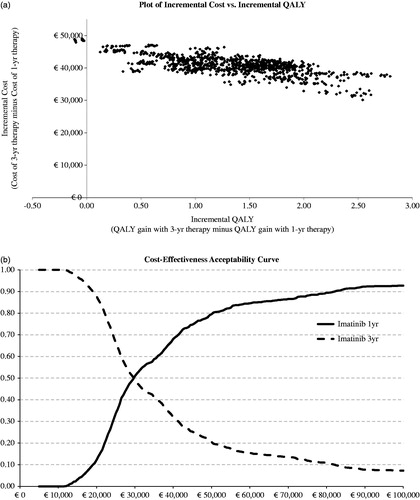
Figure 4. Scatterplot of incremental cost and incremental QALYs (base case scenario), and cost-effectiveness acceptability curve.