Figures & data
Table 1. Demographic and baseline characteristics and concomitant medications by treatment group.
Figure 1. The mean thrice weekly dose of paricalcitol (diamonds and left vertical axis) and mean daily dose of cinacalcet (squares and right vertical axis) for each week of the study period. The mean dose of paricalcitol declined over the study, whereas for cinacalcet it increased. Weeks 21–28 was considered the evaluation period.
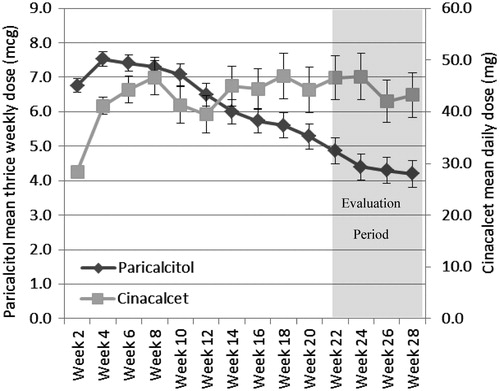
Figure 2. The percentage of patients in the paricalcitol and cinacalcet groups who were receiving concomitant calcium and non-calcium phosphate binders at baseline, week 15, and week 28. Only those subjects completing the study are included. Patients were counted if they had used a phosphate binder the day of or 7 days prior to the visit. A greater percentage of patients in the cinacalcet group required calcium-containing phosphate binders, whereas the opposite is true for non calcium-containing phosphate binders.
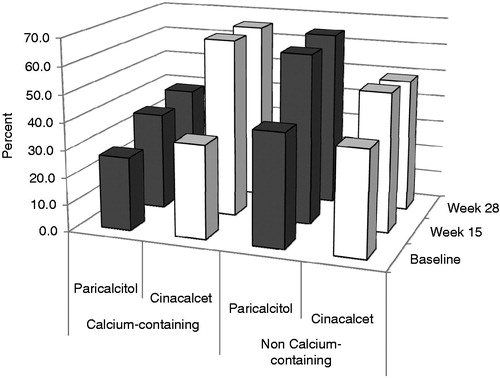
Table 2. Costs by treatment group.
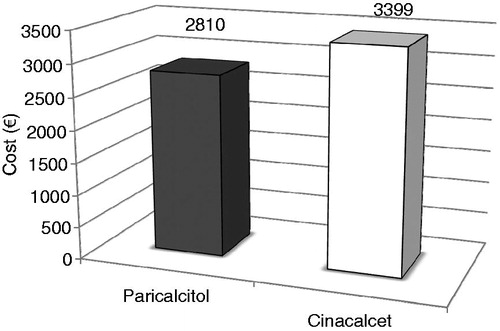
Figure 3. The mean total cost per responder by treatment group. There were 61 responders in the paricalcitol group and 39 responders in the cinacalcet group.