Figures & data
Table 1. Response summary (number and percentage of responders for cinacalcet and control groups).
Table 2. Medication wholesale acquisition cost (in US$) and trial-based utilization.
Table 3. Medication trial-based costs ($)*.
Table 4. Average cost ($) per response by definition of response across the 23 week trial period.
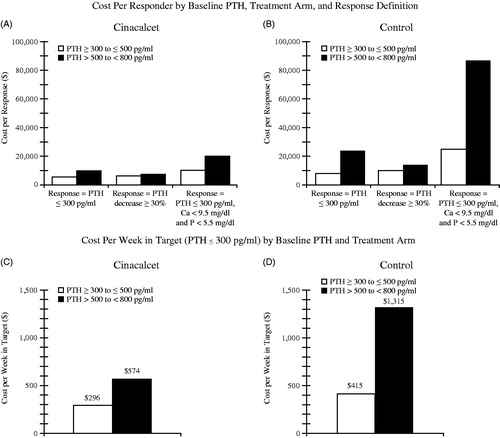
Figure 1. Cost per response results by treatment arm and disease severity. *Incremental cost per incremental responder was calculated as the change in the mean per patient costs between cinacalcet and control arms divided by the change in the percentage of patients responding between cinacalcet and control arms. The incremental (cinacalcet – control) cost per incremental responder ranged from $5186–$9168. The incremental increase in mean time spent as a responder ranged from 6.5–10.1 weeks between the cinacalcet and control arms.