
Figures & data
Table 1. Characteristics (nationally and regionally) among patients with RA who initiated TNF-blocker therapy and remained persistent for at least 12 months.
Figure 1. Regional proportion and magnitude of dose escalation using the average weekly dose method among RA biologic-naïve patients persistent on TNF-blocker therapy for 12 months.
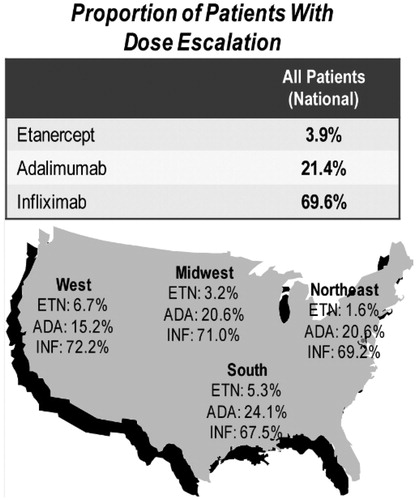
Table 2. National proportion and magnitude of dose escalation among RA biologic-naïve patients persistent on TNF-blocker therapy for 12 months for each dose escalation method.
Figure 2. Regional proportion and magnitude of dose escalation using the average ending dispensed dose method among RA biologic-naïve patients persistent on TNF-blocker therapy for 12 months.
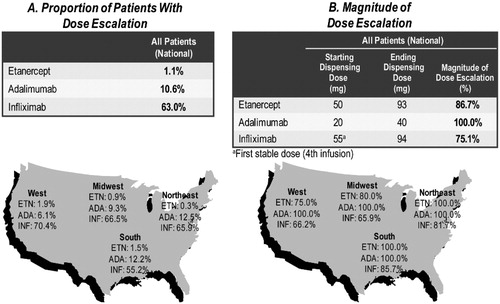
Figure 3. Regional proportion and magnitude of dose escalation using the average dose after maintenance dose method among RA biologic-naïve patients persistent on TNF-blocker therapy for 12 months.
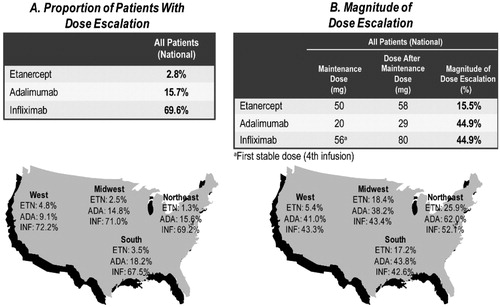
Table 3. Cost of TNF-blocker therapy per treated RA patient.