
Figures & data
Table 1. Sample demographic characteristics.
Figure 1. Recovery time from an event. A = After you woke up that night, how long did it take to realize you were having a hypo before you did something about it? B = After you woke up that night, how long did it take after realization to do something about the hypo, including monitoring your blood sugar, going to get something to eat or drink, and then eating or drinking it? C = After you woke up that night, how long did it take for all of your acute hypoglycemic symptoms to go away after you had something to eat or drink? D = After you woke up that night, how long did it take before you felt like you were functioning again at your usual or normal level after you had something to eat or drink?
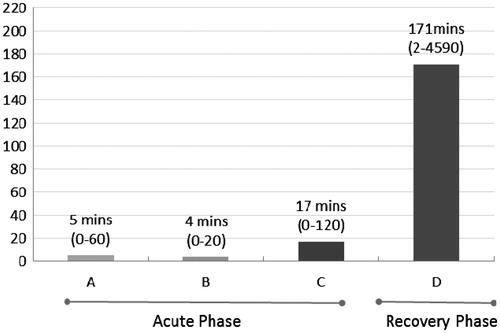
Table 2. Impact of NSNHE on diabetes management.
Table 3. Impact of an NSNHE on work productivity.
Figure 2. Functional, emotional, and social impact on day after NSNHE.
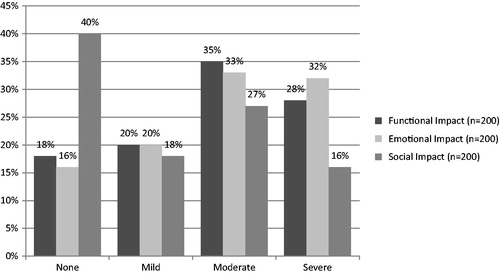
Table 4. Economic burden of NSNHEsa.