Figures & data
Figure 1. Markov model diagram. SVR, sustained virologic response; HCV, hepatitis C virus.
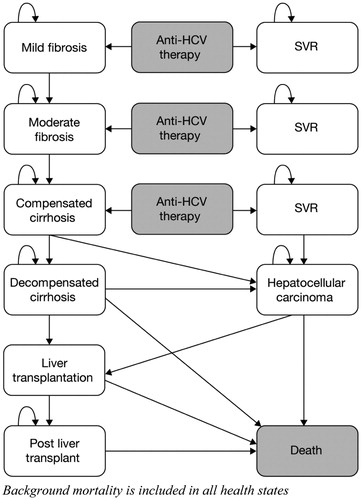
Table 1. Annual transition probabilities (TPs) used within the Markov model.
Table 2. Model inputs.
Table 3. Sustained virological response (SVR) rates inputted into the model.
Table 4. Cost-effectiveness results: base case.
Table 5. Cost-effectiveness results: sub-group analyses.
Figure 2. Tornado chart of cost per QALY gained for the T/PR regimen vs PR alone. PR, peginterferon/ribavirin; T/PR, telaprevir plus PR; SVR, sustained virologic response; SOC, standard of care; QALY, quality-adjusted life-year; ICER, incremental cost-effectiveness ratio.
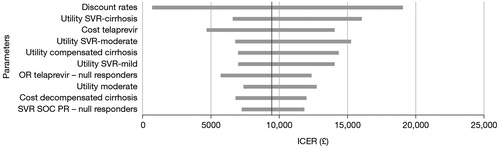
Figure 3. Cost-effectiveness plane: cost per QALY (£/QALY) gained for the T/PR regimen vs PR alone. PR, peginterferon/ribavirin; T/PR, telaprevir plus PR; QALY, quality-adjusted life-year.
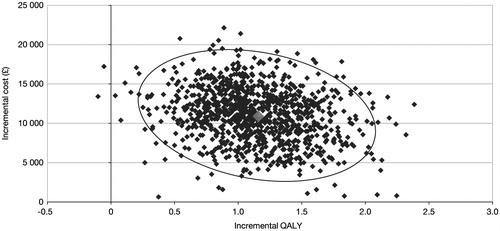
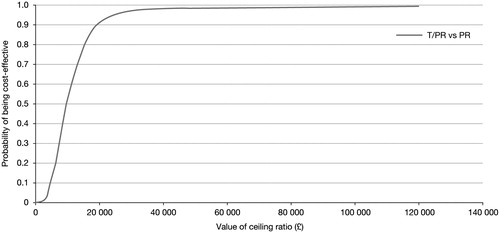
Figure 4. Cost-effectiveness acceptability curve based on the cost per QALY (£/QALY) gained for the T/PR regimen vs PR alone and vs B/PR. PR, peginterferon/ribavirin; B/PR, boceprevir plus PR; T/PR, telaprevir plus PR; QALY, quality-adjusted life-year.