Figures & data
Figure 1. Comparison of IP admissions between cohorts. The 0, 1–2, and 3–4 tests cohorts had an average of 0.33, 0.28, and 0.17 IP admissions per-patient-per-year. IP, in-patient admissions; IRR, incidence rate ratio.
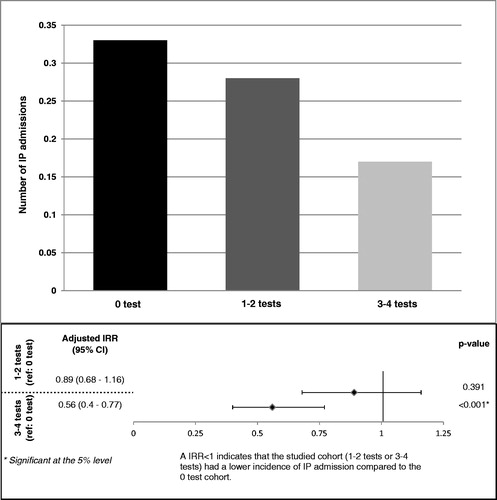
Figure 2. Comparison of medical service costs between cohorts. The average medical cost for the 0 test cohort was $1518 higher than the 1–2 tests cohort ($18,220 vs $16,702, p < 0.001), and was $3394 higher than the 3–4 tests cohort ($18,220 vs $14,825, p < 0.001). With adjustment of potential confounding factors, there was a difference in medical service costs of $5997 (p = 0.049) between the 0 and 3–4 tests cohorts.
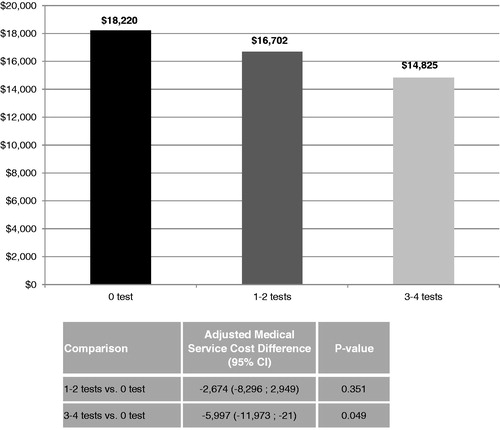
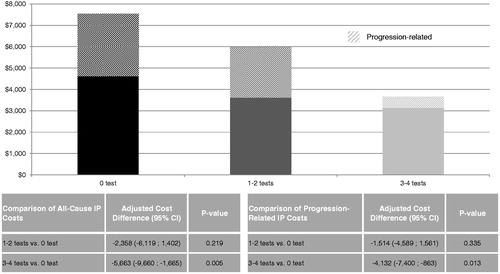
Figure 3. Comparison of all-cause and progression-related IP costs between cohorts. Once adjusted for potential confounding factors, the IP cost difference between the 0 and 3–4 tests cohorts was $5663 (p = 0.005). The IP costs difference between the 0 and 1–2 tests cohorts was not statistically significant (difference = $2358; p = 0.219). The progression-related IP cost difference between the 0 and 3–4 tests cohorts was $4132 (p = 0.013). The progression-related IP costs difference between the 0 and 1–2 tests cohorts was not statistically significant (difference = $1514; p = 0.335). CI, confidence interval; IP, in-patient admissions.