Figures & data
Figure 1. Average market exclusivity period by year of first generic entry: new molecular entities.
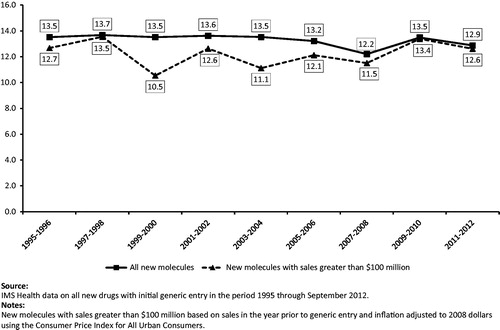
Table 1. Average market exclusivity period by year of first generic entry.
Figure 2. Average number of generic entrants within 1 year of first generic entry: new molecular entities.
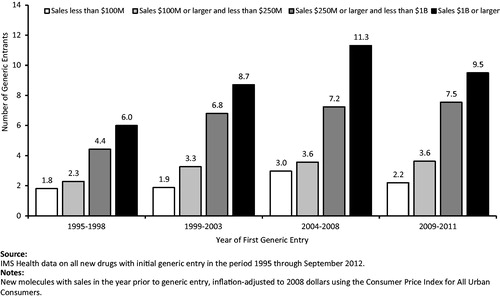
Figure 3. Paragraph IV filing frequency and timing (3-year moving average).
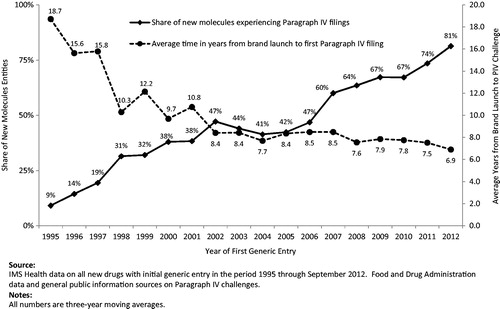
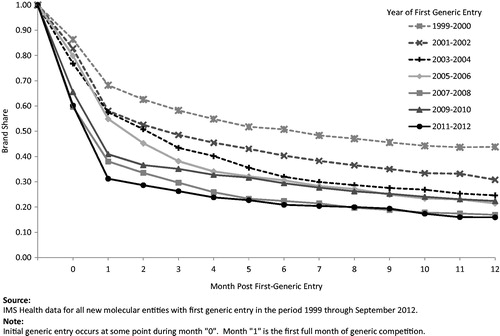
Figure 4. Average monthly brand share of standard units of the molecule/form following first generic entry.