
Figures & data
Figure 1. Graphical representation of the incident cost model.
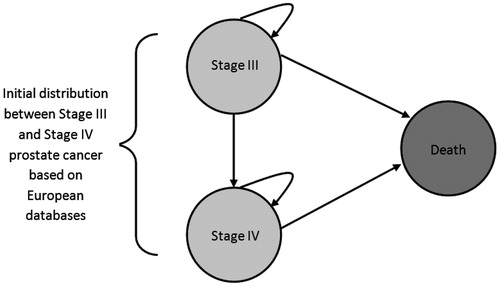
Table 1. Key data used in the cost model.
Figure 2. Distribution of patients over time.
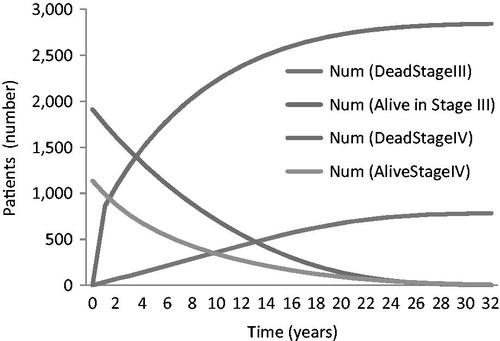
Figure 3. Results of sensitivity analysis: Tornado diagram—costs (€) per individual.
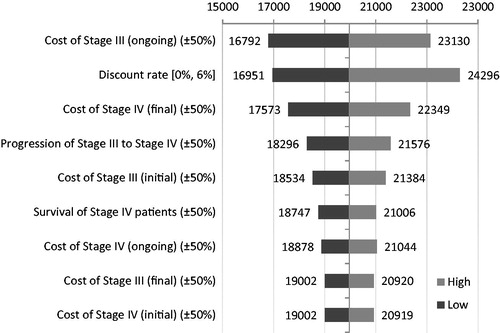
Table 2. Base case results: mean advanced PCa life-time costs.