Figures & data
Figure 1. Study design, duration, and selection criteria.
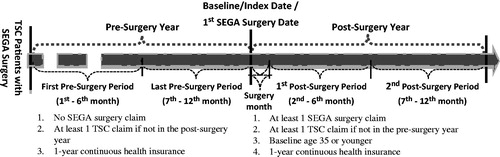
Figure 2. Sample selection scheme.
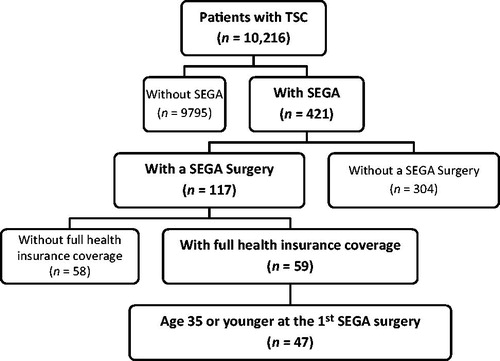
Table 1. Percentages of patients with a claim for SEGA-related conditions in three different time periods.
Figure 3. Cross-period comparison of direct medical costs by half and full years. All cross-period differences were statistically significant based on repeated measures analysis with bootstrapping.
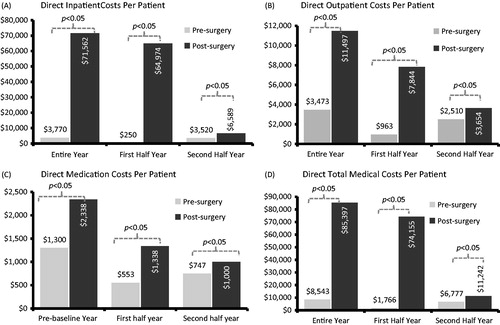
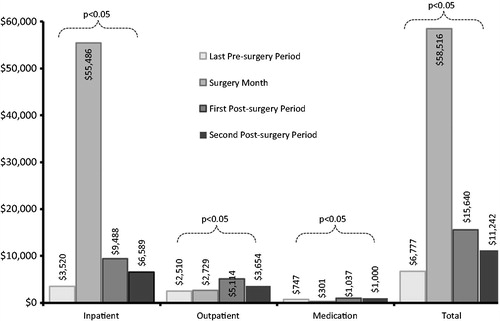
Figure 4. Cross-period comparison of direct medical costs by study period. All cross-period variations were statistically significant based on repeated measures analysis with bootstrapping. Also, the last pre-surgery period was 6 months before the surgery, the first post-surgery period was from the 2nd through 6th post-surgery month, and the second post-surgery period was from the 7th through 12th post-surgery month.