Figures & data
Table 1. Baseline model assumptions.
Table 2. DVT and PE outcomes.
Figure 1. Per patient costs of DVT over 1 year. *Original scenario (100% LMWH/warfarin): 1-year total = $18,904; **Projected scenario (75% LMWH/warfarin; 25% RIVA): 1-year total = $18,722. 2013 USD. DVT, deep vein thrombosis; LMWH, low molecular weight heparin; PE, pulmonary embolism; RIVA, rivaroxaban.
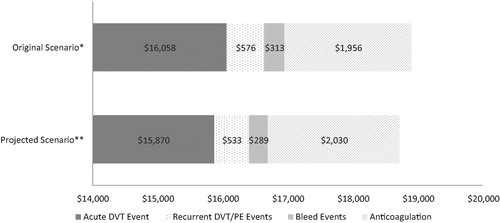
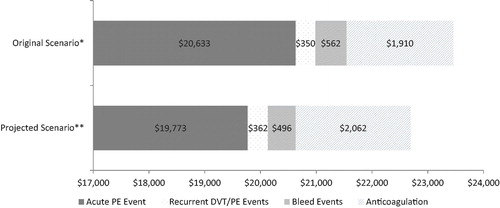
Figure 2. Per patient costs of PE over 1 year. *Original scenario (100% LMWH/warfarin): 1-year total = $23,455; **Projected scenario (75% LMWH/warfarin; 25% RIVA): 1-year total = $22,693. 2013 USD. DVT, deep vein thrombosis; LMWH, low molecular weight heparin; PE, pulmonary embolism; RIVA, rivaroxaban.