Figures & data
Figure 1. Graphic representation of the model.
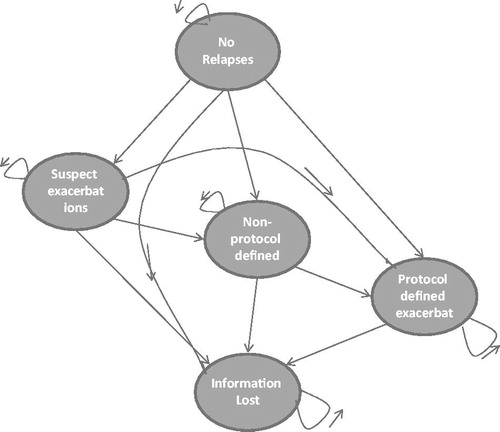
Table 1. Transition probabilities for the first year; GA and IFN in monotherapy and combined IFN + GA*.
Table 2. Drug costs for GA 20 mg, IFN 30 mg, and GA + IFN, per unit and year.
Table 3. Annual resource utilization in units and unit costs in EUR 2013.
Table 4. Total annual cost in EUR 2013 per health state.
Table 5. Total cost, incremental costs, relapse, relapse avoided and ICER.
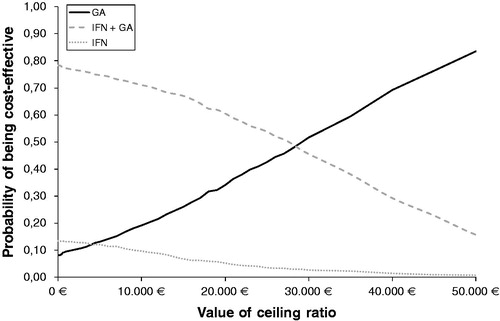
Figure 2. Cost-effectiveness acceptability curves.