Figures & data
Table 1. Characteristics of the patients at baseline*.
Figure 1. Kaplan-Meier survival curves showing the mean times in TOX, TWiST, and REL states. (a) Nab-paclitaxel + gemcitabine; (b) Gemcitabine.
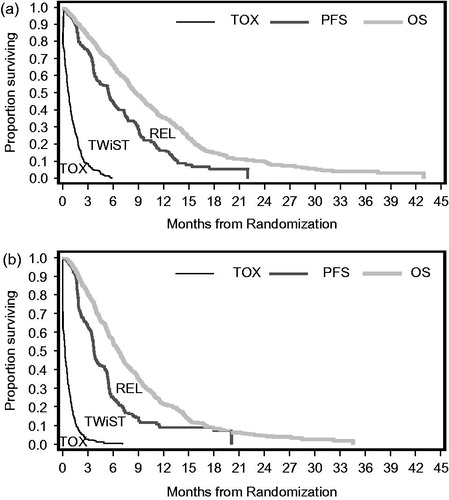
Table 2. Mean duration of health states through 45 months, by treatment.
Figure 2. Utility threshold plot through 45 months. The y-axis represents the utility for toxicity (UTOX) time and the x-axis represents the utility for time after disease progression (UREL). Both vary from 0–1, while the utility of TWiST is fixed at 1. The diagonal bands of different colors or shading represent increasing Q-TWiST gains (from the lower left corner to the upper right corner of the plot). To understand the Q-TWiST gain associated with a given combination of UTOX and UREL, one must select the corresponding values of UTOX and UREL on the y-axis and x-axis, respectively. The intersection of these two values inside the plot indicates to which band of Q-TWiST gain the results from this combination belong to. For instance, the base case use UTOX = 0.5 and UREL = 0.5, which intersect in the 1.5–1.8 Q-TWiST gain and are consistent with the point estimate of 1.7 months. Note that all Q-TWiST gains in this plot are statistically significant.
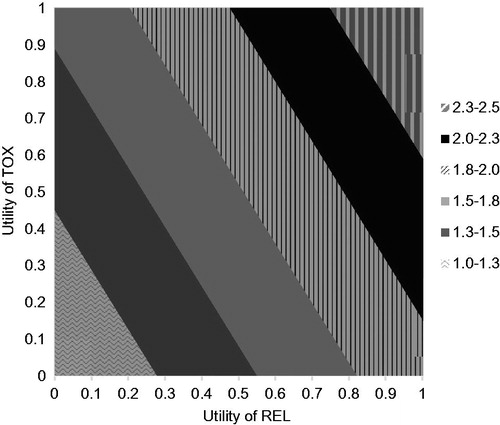
Figure 3. Plot of relative Q-TWiST gain through 45 months. The y-axis represents the utility for toxicity (UTOX) time and the x-axis represents the utility for time after disease progression (UREL). Both vary from 0–1, while the utility of TWiST is fixed at 1. The diagonal bands of different color represent increasing relative Q-TWiST gains (from the lower left corner to the upper right corner of the plot). The relative Q-TWiST gain is the percentage obtained by dividing the absolute Q-TWiST gain by the mean survival in the gemcitabine group. To understand relative Q-TWiST gain associated with a given combination of UTOX and UREL, one must select the corresponding values of UTOX and UREL on the y-axis and x-axis, respectively. The intersection of these two values inside the plot indicates to which band of relative Q-TWiST gain the results from this combination belong to. For instance, the base case use UTOX = 0.5 and UREL = 0.5, which intersect in the 19.0–21.5% relative Q-TWiST gain and is consistent with the point estimate of 20.2%.
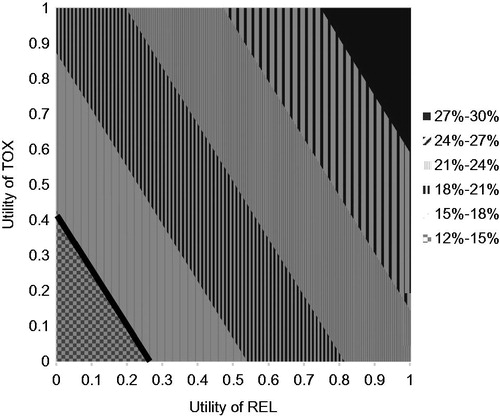
Table 3. Mean duration of Q-TWiST through 45 months, by treatment.
Figure 4. Differences in Q-TWiST (base case) among pre-specified sub-groups through 45 months. *The percentage for the level of CA19-9 was calculated based on the number of total patients with CA19-9 data: 116/750 = 15%, 242/750 = 32%, and 392/750 = 52%. No. of patients (%), number of patients (%); Mean diff (95% CI), mean difference (95% confidence interval); GEM, gemcitabine; Nab-Paclitaxel + GEM, albumin-bound paclitaxel + gemcitabine; CA 19-9, carbohydrate antigen 19-9.
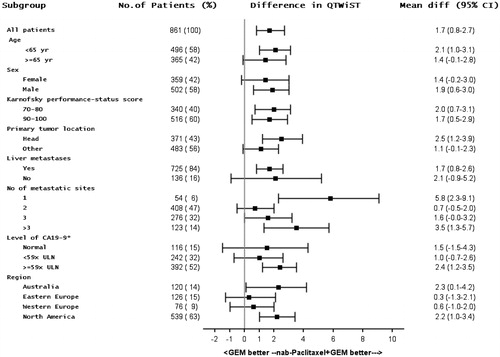
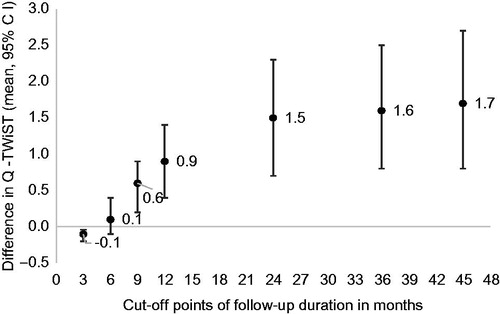
Figure 5. Difference in the Q-TWiST at various follow-up durations. CI, confidence interval. Note: the survival rate at 3-, 6-, 9-, 12-, 24-, 36, and 45-months between treatment groups (nab-paclitaxel-gemcitabine vs gemcitabine alone) were 83% vs 80%, p = 0.324, 66% vs 56%, p = 0.001, 49% vs 37%, p < 0.001, 36% vs 23%, p < 0.001, 15% vs 10%, p < 0.001, 12% vs 8%, p = 0.074, 12% vs 8%, p = 0.092, respectively.