
Figures & data
Figure 1. Selection of VLU patients and non-VLU patients. Notes: 1. Total patient population includes all beneficiaries with at least one medical claim in years evaluated. 2. VLU patients defined as those with at least one claim with ICD-9-CM: 454.0x, 454.1x, 454.2x, 459.11, 459.13, 459.31, 459.33, and 459.81 in years evaluated. 3. Index date defined as the most recent VLU diagnosis date meeting all sample selection criteria. 4. Index date defined as the date of a random medical claim in years evaluated.
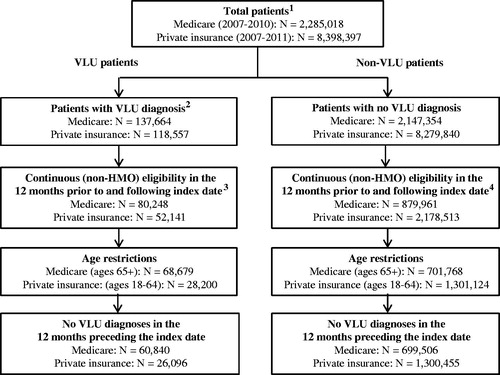
Table 1. Patient characteristics, resource utilization, and healthcare costs during the 12 months prior to the index date—Medicare.
Table 2. Patient characteristics, resource utilization, and healthcare costs during the 12 months prior to the index date—Private insurance.
Figure 2. Components of per-patient all-cause healthcare cost differential during the 12-month follow-up period (VLU—matched non-VLU patients). Notes: 1. Percentages reflect the share of excess costs attributable to the place of service. 2. Prescription drug claims were not available for Medicare.
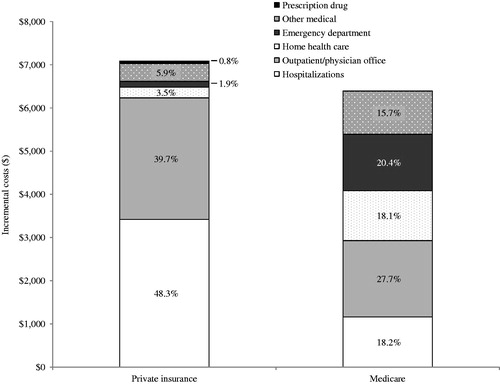
Table 3. Healthcare resource utilization and direct costs during the 12 months following the index date among matched VLU and non-VLU patients*.
Table 4. Disability, absenteeism, and related costs among matched VLU and non-VLU patients—privately-insured primary beneficiaries onlya.
Table 5. Estimated annual incidence of VLU in Medicare and private insurance.
Table 6. Estimated economic burden of VLUs in the US—by payer type.