Figures & data
Table 1. Summary demographic characteristics.
Figure 1. Mean length of stay (days). *p Values vs TAVI: *1p = 0.36; *2p = 0.48; *3p = 0.17; *4p = 0.20; *5p = 0.11; *6p = 0.23.
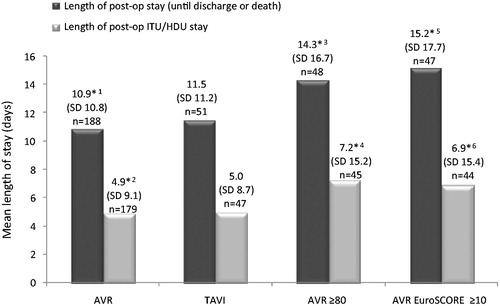
Figure 2. Discharge destination following procedure.
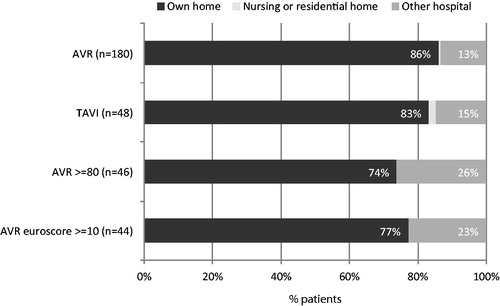
Figure 3. Post-procedure vital status at 30 days.
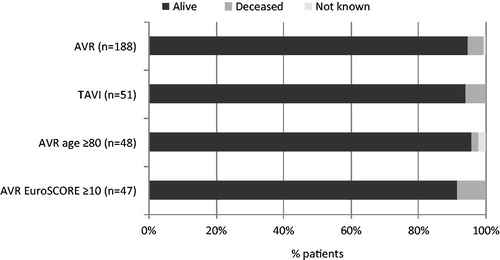
Figure 4. Post-procedure vital status at 6 months.
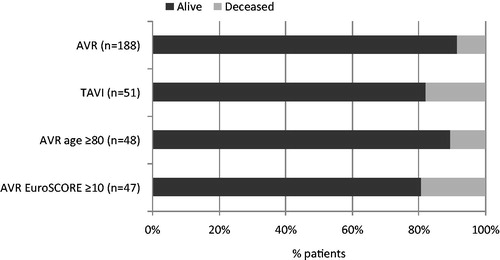
Table 2. Proportion of patients re-admitted within 30 days post-discharge or during the 6 months post-procedure (unplanned cardiac-related re-admissions only).
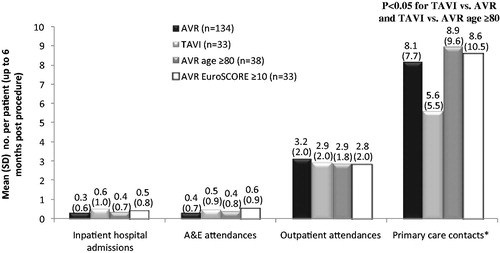
Figure 5. Resource use associated with post-discharge care. ‘Primary care contacts’ includes any recorded primary care visit or contact (at the GP surgery, patient’s home or via telephone) with any health professional (GP, nurse, physiotherapist, other).