Figures & data
Figure 1. Processes of the article extraction.
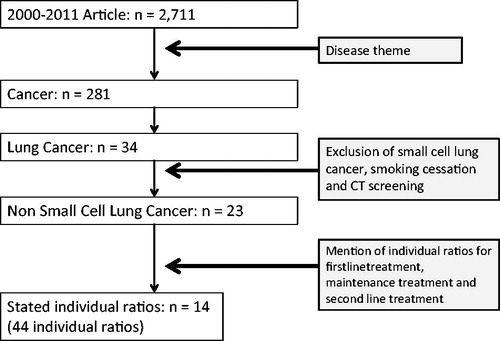
Figure 2. Scatter plot and clusters for non-small cell lung cancer by treatment stage: log model. Eclipses express the clusters of QALY-cost ratios.
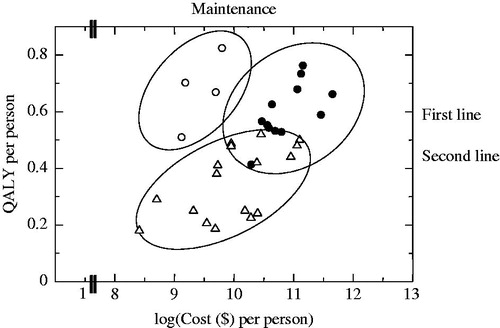
Table 1. Correlation coefficients for cost and QALY data stratified by treatment stage.
Figure 3. Three regression line plots for non-small cell lung cancer by treatment stage: log model. Equations used here are following: first line treatment: QALY = −1.12 + 0.16 log(Cost), maintenance treatment: QALY = −1.99 + 0.28 log(Cost), second line treatment: QALY = −0.69 + 0.10 log(Cost).
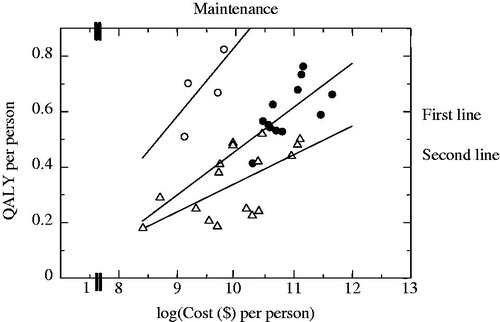
Figure 4. Two regression line plots for non-small cell lung cancer by treatment stage: log model. Equations used here are following: maintenance treatment: QALY = −1.99 + 0.28 log(Cost), first + second line treatment: QALY = −1.24 + 0.16 log(Cost).
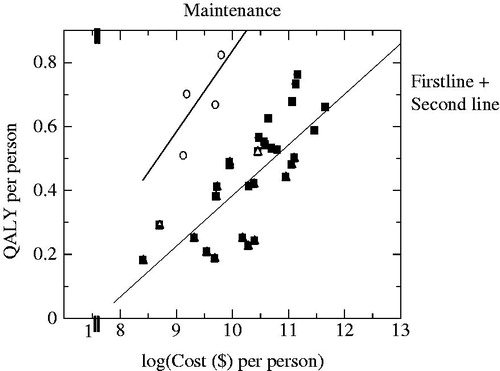
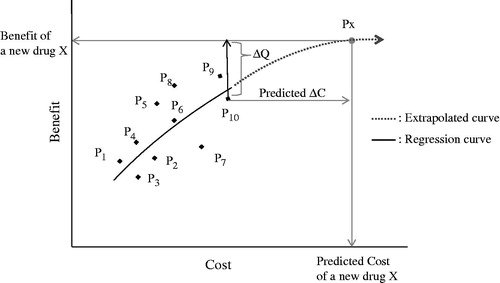
Figure 5. Extrapolation of regression curve: The horizontal line, higher by ΔQ (assumed known) than P10, determines Px at the point of intersection to the extrapolated curve. Then the vertical line from Px down to the x-axis determines the predicted cost of the new drug X, even if the price of X is not determined yet. Px, Point of a new drug X; P1, P2, … P10, Original points for regression. P10, Point of comparator for a new drug X; ΔQ, Gained benefit of a new drug X compared to the comparator P10; ΔC: Increased cost of a new drug X compared to the comparator P10.