Figures & data
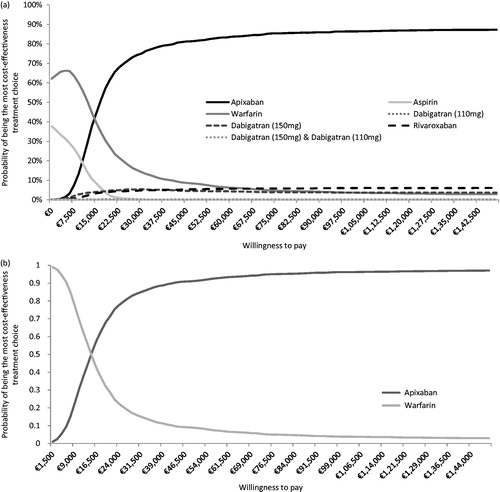
Figure 1. Schematic of Markov model. ASA, aspirin; CRNM, clinically relevant non-major; ICH, intracranial hemorrhages; NVAF, non-valvular atrial fibrillation; AC, anticoagulant; IS, ischemic stroke; HS, Hemorrhagic stroke.
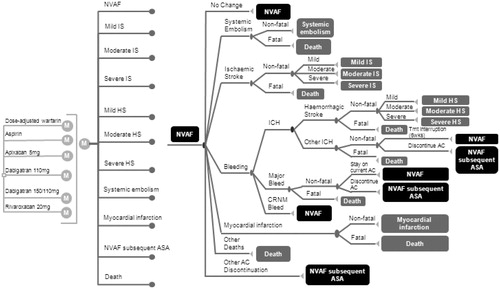
Table 1. Clinical event rates by treatment.
Table 2. Model inputs on costs (all taxes included).
Table 3. Model inputs on utilities.
Table 4. Base case results—total number of events, costs, life-years, and QALYs.
Figure 2. Efficiency frontier comparing treatment strategies for stroke prevention in AF.
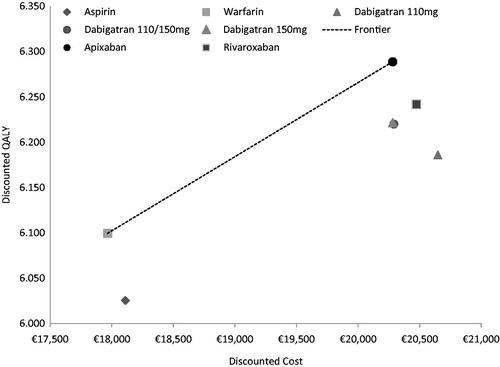
Figure 3. Results of the univariate sensitivity analysis. (a) Percentage of scenarios in which each strategy was efficient, extendedly dominated or strictly dominated. (b) Tornado diagram apixaban vs warfarin. The efficiency frontier was calculated in each sensitivity analysis, where each parameter was varied by their 95% confidence intervals as detailed in Supplementary Appendix A. The percentage of scenarios in which each strategy appeared on the frontier (denoted as efficient) was calculated as the number of scenarios in which the alternative was non-dominated using the number of total scenarios (i.e., 219) as a denominator. The percentage of scenarios in which each strategy was extendedly dominated or strictly dominated was calculated in a similar manner.
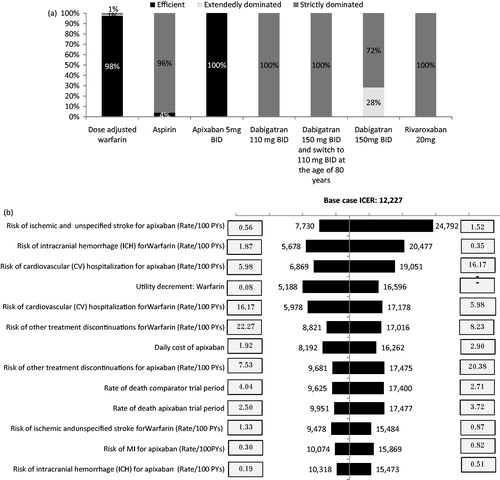
Figure 4. Results of the probabilistic sensitivity analyses. (a) Multi-way CEAC. (b) CEAC vs warfarin (non-dominated strategy).