Figures & data
Figure 1. Simplified Schematic of the Model.
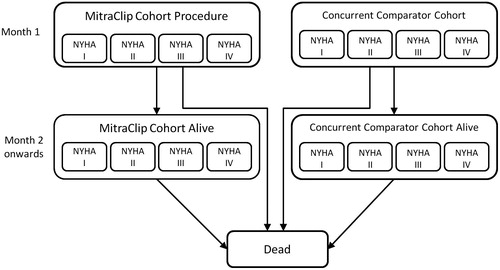
Figure 2. Observed and modelled overall survival.
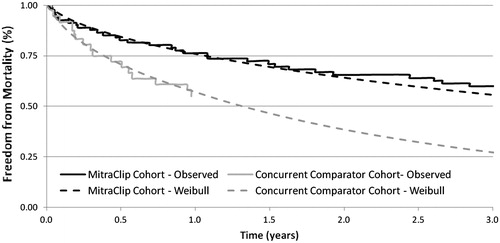
Table 1. Base case model inputs for transition probabilities and probability of events.
Table 2. Resource utilization and costs associated with the MitraClip procedure.
Table 3. Resource utilization and costs associated with clinical events and disease management.
Table 4. Summary of alternative parameter estimates utilized in one-way sensitivity analyses.
Table 5. Summary of parameter estimates and distributions used in the probability sensitivity analysis.
Table 6. Base case analysis results for MitraClip therapy vs concurrent comparator.
Table 7. Results for the one-way deterministic sensitivity analyses.
Figure 3. Scatterplot showing the results of the incremental costs and incremental QALYs for 10,000 runs of the probabilistic sensitivity analysis. The dashed line shows acceptability thresholds of $50,000 per QALY gained. Nearly all results fall below the $50,000 threshold.
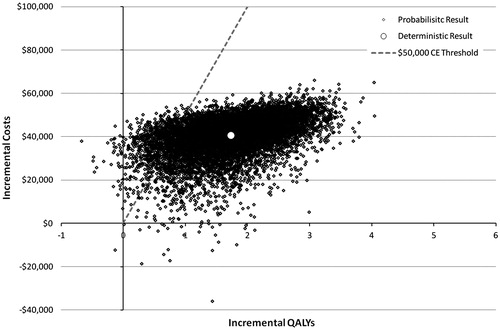
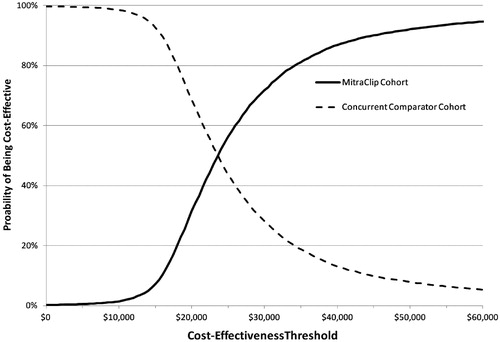
Figure 4. Cost-acceptability curve (CEAC). Cost-acceptability curve (CEAC). In approximately 92% of the runs, MitraClip therapy was cost-effective versus standard of care at a threshold of $50,000 per QALY gained.