Figures & data
Figure 1. Schematic representation of study design.
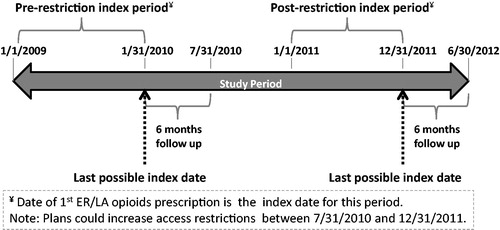
Figure 2. Patient attrition.
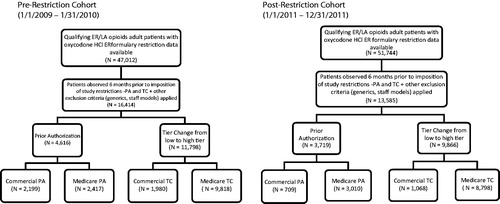
Table 1. Demographics and baseline characteristics by plan type.
Table 2. Most frequent baseline comorbidities (by ICD-9 grouping).
Table 3. ER/LA opioid utilization over 6 months from pre- to post-restriction.
Figure 3. Change in healthcare resource utilization over 6 months (post-restriction – pre-restriction). Resource counts are measured in terms of number of outpatient (OP) visits (all outpatient encounters captured through the CMS-1500 billing form) or number of prescriptions filled. All bars represent average 6-month difference in resource counts from pre-restriction to post-restriction periods. Bootstrapping t-test was utilized to test the differences in resource utilization. *0.001 < p ≤ 0.05; **p ≤ 0.001.
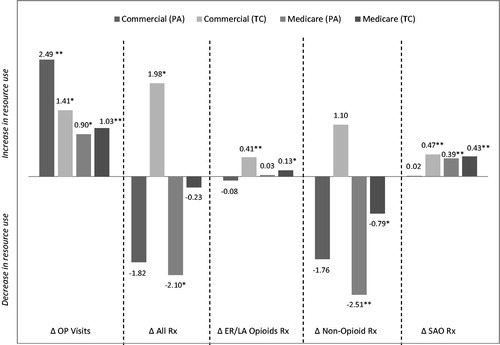
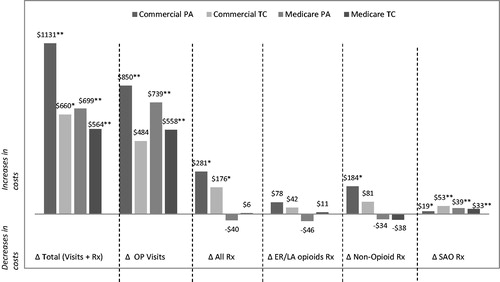
Figure 4. Change in healthcare costs over 6 months (post-restriction – pre-restriction). Outpatient (OP) visits include all outpatient encounters captured through the CMS-1500 billing form. All bars represent average 6-month difference in charge amounts from pre-restriction to post-restriction periods (normalized to 2012 dollars). Generalized linear model with gamma distribution and a log-link was utilized to test the differences in costs. *0.001 < p ≤ 0.05; **p ≤ 0.001.