Figures & data
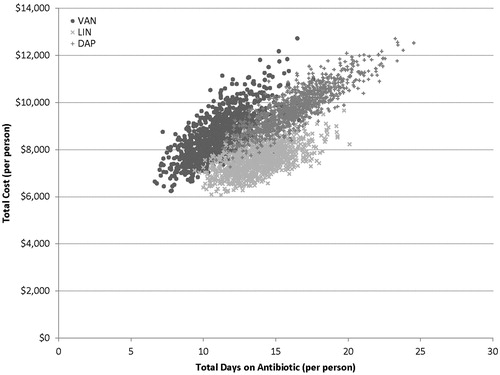
Figure 1. Overview of model flow.
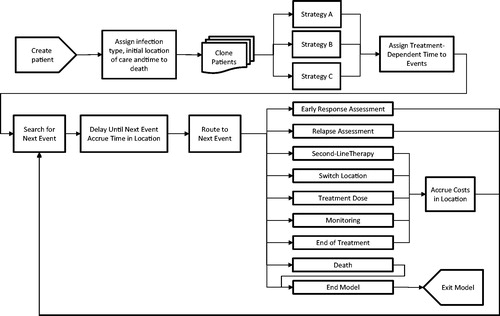
Figure 2. Treatment strategies for the three cohorts.
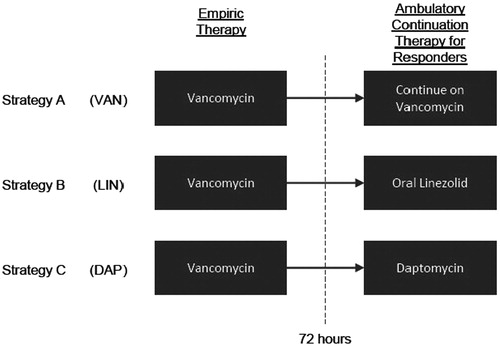
Table 1. Model inputs and data sources.
Table 2. Mean total number of days on antibiotic and mean costs per patient accrued in each location of care.
Figure 3. ED + inpatient and outpatient costs (per patient) and total days on antibiotic in the outpatient setting as a percentage of patients that are admitted following the first dose in the ED is varied [VAN cohort].
![Figure 3. ED + inpatient and outpatient costs (per patient) and total days on antibiotic in the outpatient setting as a percentage of patients that are admitted following the first dose in the ED is varied [VAN cohort].](/cms/asset/b8b1b70d-04c6-4c89-ae32-322d44c142c9/ijme_a_941065_f0003_b.jpg)
Table 3. Mean total number of days on antibiotic and mean costs per patient—results from scenario analyses for VAN, LIN, and DAP.
Figure 4. Results from the PSA (total days on antibiotic and total costs per patient) for each of the 1000 trials for VAN, LIN, and DAP.