Figures & data
Figure 1. Model tree.
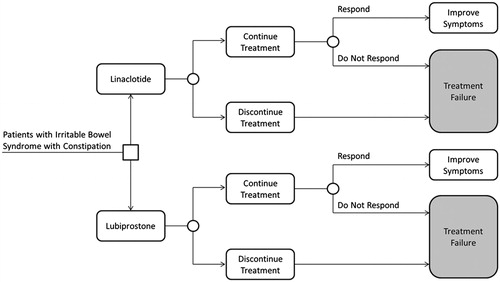
Table 1. Base-case and sensitivity analysis model inputs.
Table 2. Model results for 1000 patients with irritable bowel syndrome with constipation (direct costs only).
Figure 2. Probabilistic sensitivity analysis results for cost per patient and probability of response; (a) response based on IBS-QoL, and (b) response based on global assessment. Each point on graph represents the result of one of a thousand iterations of a second order Monte Carlo simulation.
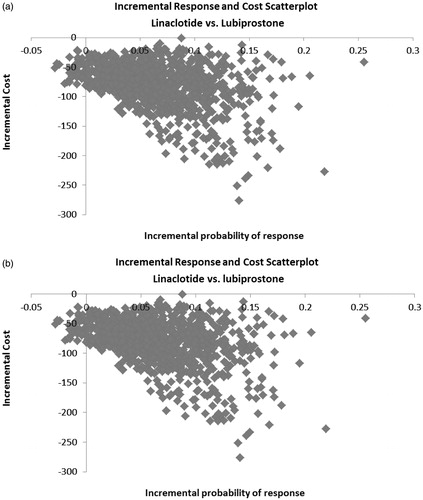
Table A1. Odds of response by definition of irritable bowel syndrome with constipation response to treatment.
Table A2. Actual and fitted distribution of irritable bowel syndrome with constipation quality-of-life responders.
Table A3. Physician survey results for the practice patterns of patients with irritable bowel syndrome with constipation.
Table A4. Costs of procedures and tests for irritable bowel syndrome with constipation.
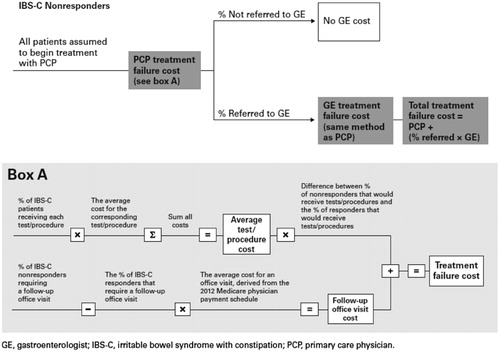
Figure A1. Treatment failure calculation.