Figures & data
Table 1. Resource use and costs.
Table 2. Efficacy inputs.
Table 3. Drug costs*.
Table 4. Probabilities of and cost of managing comorbiditiesCitation34.
Figure 1. Treatment sequences compared. ER, extended release; IR, immediate release.
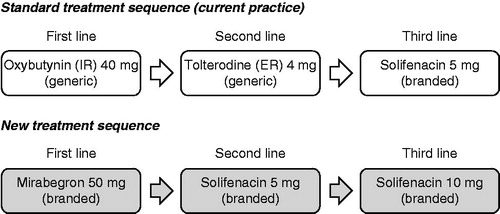
Table 5. Patient outcomes per 1000 patients treated.
Table 6. Cost and resource use per 1000 patients treated.
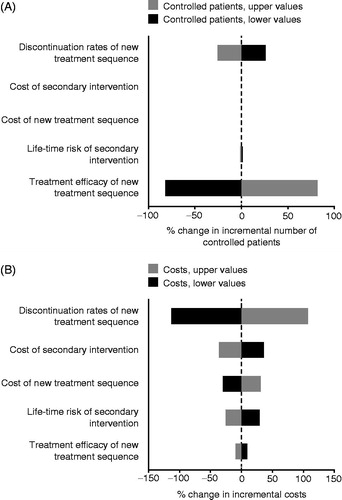
Figure 2. Tornado diagram showing results of the deterministic sensitivity analysis in which each parameter was separately varied by 20%. (a) Percentage change in incremental number of controlled patients; (b) percentage change in incremental costs.