Figures & data
Table 1. Numbers and proportions of ambulatory diagnoses (ICD-10 GM) of dementia during the study period.Citation1.
Figure 1. Study design of propensity score matched cohort.
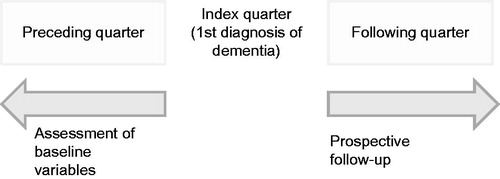
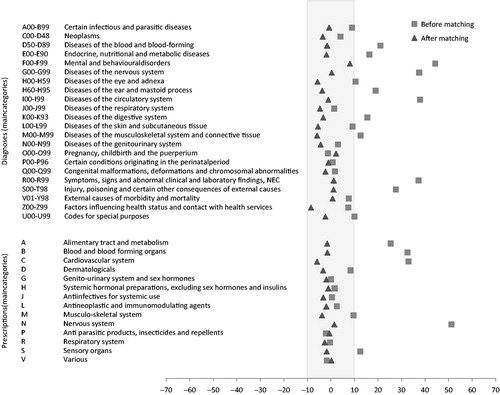
Figure 2. Standardized differences (Love plot, difference in percent) of diagnoses and prescriptions before and after propensity score matching (Alzheimer’s dementia).