Figures & data
Figure 1. Study design.
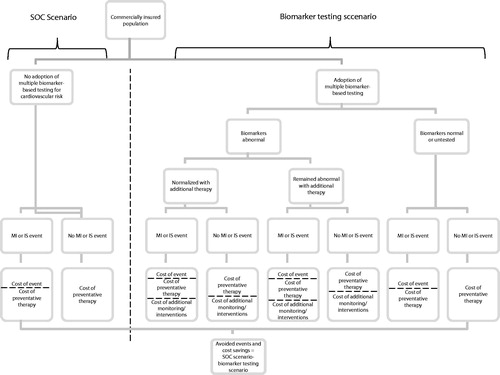
Table 1. Twelve-month CV-event incidence per 10,000 persons by gender and age*.
Table 2. Cost inputs.
Figure 2. Distribution of biomarker test results and relative risk ratios. Categories are mutually exclusive. HR indicates hazard ratio.
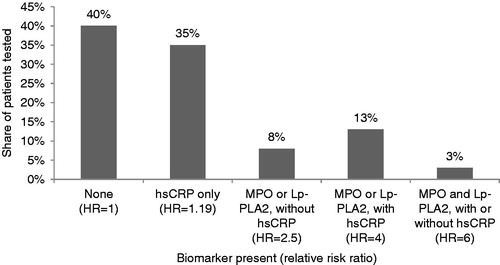
Table 3. Assumed biomarker testing rates by gender and age, column %.
Table 4. Estimated number of non-fatal MI and non-fatal IS events over 5 years.
Table 5. Estimated change in related healthcare costs over 5 years, in $ thousands.
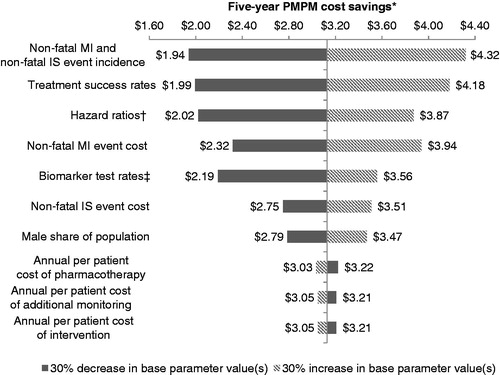
Figure 3. Sensitivity of estimated healthcare cost savings to changes in base input values. *PMPM indicates per-member-per-month in reference to cost savings/increase resulting from adoption of biomarker testing. †Hazard ratios were not permitted to fall below one. ‡Biomarker test rates were not permitted to exceed 90%.