Figures & data
Figure 1. Cohort identification for the policy change versus all other analysis.
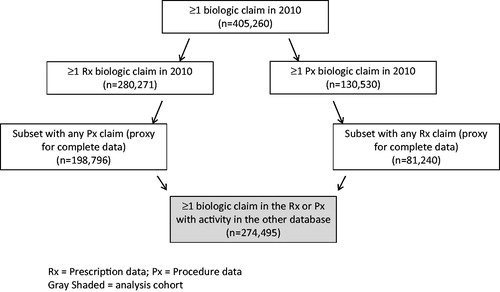
Figure 2. Cohort identification for the policy change versus matched plans.
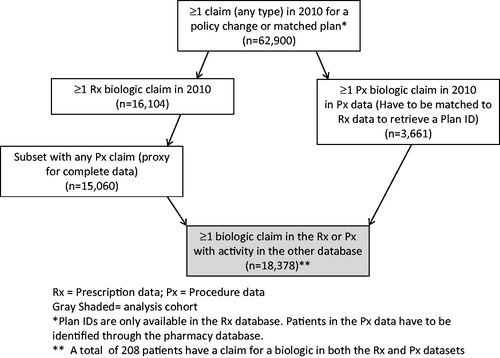
Figure 3. Pre–Post analysis inclusion/exclusion criteria and follow up time.
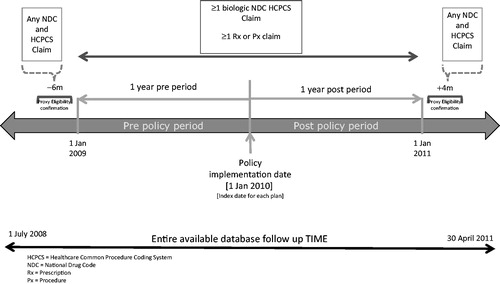
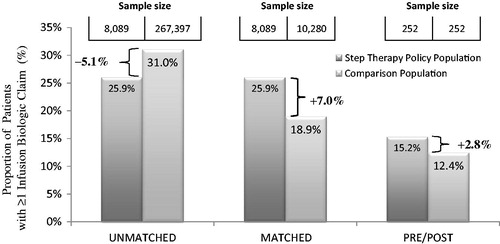
Figure 4. Percentage of patients with ≥1 infusion biologic claim by step therapy status and cohort.