Figures & data
Table 1. UK population distributed by age group and risk status.
Table 2. Rate of movement from healthy status to at-risk status in each annual cycle by age*.
Table 3. Vaccine efficacy and coverage rates.
Table 4. Probabilities of events.
Table 5. Age-dependent cost data.
Table 6. Age-dependent cost data used only in the analysis from a societal perspective.
Table 7. Age-dependent costs of yearly productivity loss due to premature death*.
Table 8. Age-dependent utility data.
Table 9. Parameters used in the sensitivity analyses.
Table 10. Base-case results from the NHS perspective in the base-case population over a lifetime.
Table 11. Cost and ICER results from the societal perspective in the base-case population over a lifetime.
Table 12. Results from scenario analyses.
Table 13. Results from the NHS perspective in the base-case population over a 10-year time horizon.
Figure 1. One-way sensitivity analysis comparing quadrivalent with trivalent vaccination. (A) Effect of the two most important parameters. (B) Effect of the next ten most important parameters. The vertical axis indicates the incremental cost-effectiveness ratio (ICER) in the base-case = £14,645/QALY. QALY, quality-adjusted life-year; TIV, trivalent vaccination; VE, vaccine efficacy.
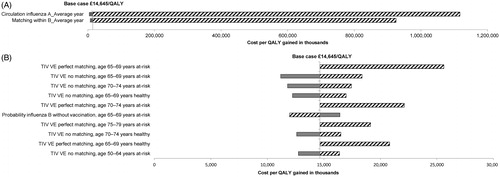
Table 14. Effects of disutility and vaccine price in sensitivity analysis, base-case population over a lifetime.
Table 15. Effects of discount rates in sensitivity analysis, base-case population over a lifetime.
Figure 2. Probabilistic sensitivity analysis comparing quadrivalent with trivalent vaccination, 1000 iterations. ICER, incremental cost-effectiveness ratio; QALY, quality-adjusted life-year; QIV, quadrivalent vaccination; TIV, trivalent vaccination.
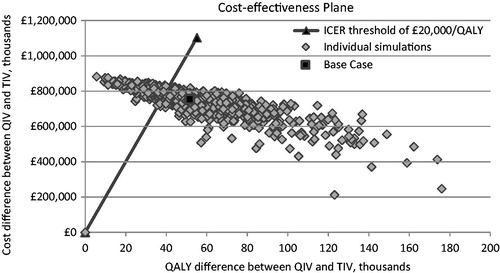
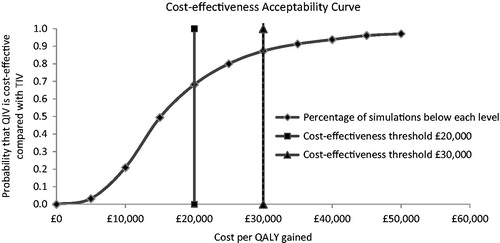
Figure 3. Cost-effectiveness acceptability curve comparing quadrivalent with trivalent vaccination. QALY, quality-adjusted life-year; QIV, quadrivalent vaccination; TIV, trivalent vaccination.