Figures & data
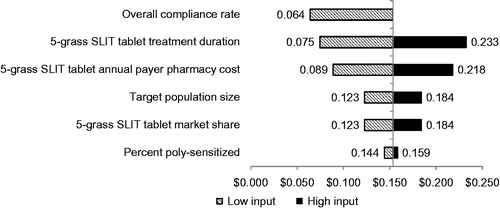
Figure 1. Model framework.
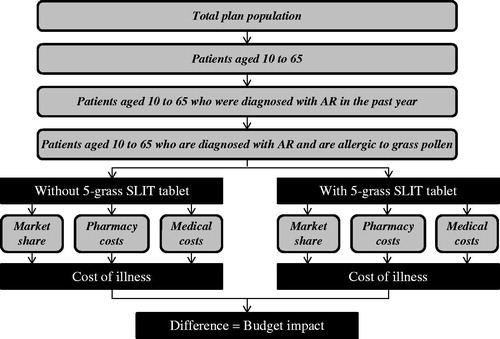
Table 1. Target population.
Table 2. Base case market share with and without the 5-grass SLIT tablet.
Table 3. Base case pharmacy costs.
Table 4. Resource utilization by encounter and treatment type.
Table 5. Budget impact (2013 USD).
Figure 2. Sensitivity analysis of total PMPM costs with ±20% variation from base case inputs – Year 1. For the overall compliance rate, the sensitivity analysis only considered a low input of 80% relative to the base case of 100%. For the percent poly-sensitized among 5-grass SLIT tablet users, the sensitivity analysis considered 0% and 100% relative to the base case of 65%.