Figures & data
Table 1. Baseline demographics and risk factors.
Table 2. Clinical efficacy and adverse events in 30 weeks based on literature review and meta-analysis.
Table 3. Annual treatment costs for study drugs.
Table 4. Annual direct medical costs for diabetes-related complications and severe hypoglycemia (2014¥).
Table 5. Health utility decrements used in base case analysis.
Figure 1. Simulated progression of HbA1c in exenatide BID + OAD (treatment arm) and insulin glargine QD + OAD (control arm) over the time horizon 40 years with a treatment escalation threshold of HbA1c ≥7.5%.
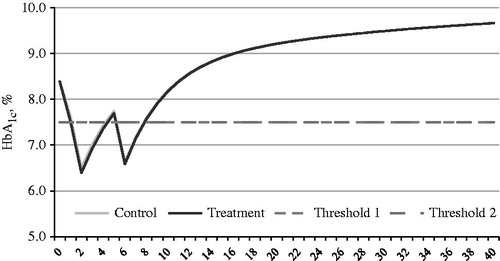
Figure 2. Simulated progression of weight in exenatide BID + OAD (treatment arm) and Insulin glargine QD + OAD (control arm) over the modeled time horizon.
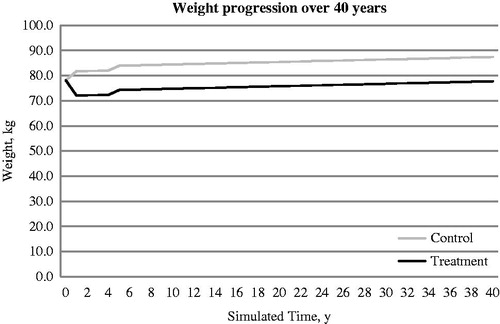
Table 6. Module output results for exenatide BID + OAD compared to insulin glargine QD + OAD.
Figure 3. Results of one way sensitivity analysis of input variables, costs, and utilities.
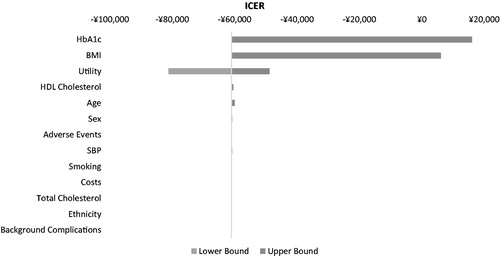
Table 7. One-way sensitivity analysis on selected variables for exenatide BID + OAD vs glargine QD + OAD in China*.
Figure 4. Scatter plot of ICERs for exenatide BID + OAD vs Insulin glargine QD + OAD. BID, twice daily; OAD, oral anti-diabetic agents; QD, once daily.
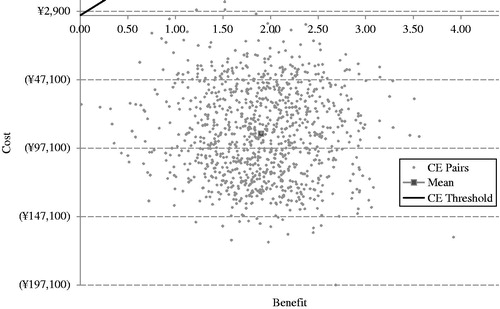
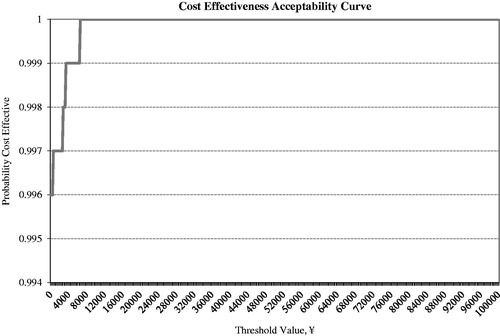
Figure 5. Cost effectiveness acceptability curve for exenatide BID + OAD vs Insulin glargine QD + OAD. BID, twice daily; OAD, oral anti-diabetic agents; QD, once daily.