Figures & data
Table 1. Treatment mix scenarios.
Table 2. Population distribution and relapse rates according to EDSS distribution.
Table 3. Discontinuation and relapse rates by treatment.Citation20
Figure 1. Difference in total annual cost. All costs reported in 2013 Canadian dollars.
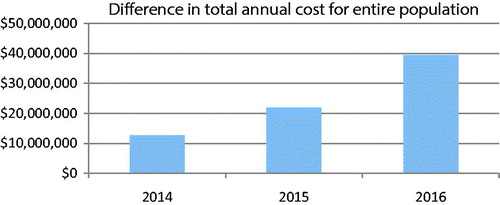
Table 4. Total cost outcomes.
Table 5. Disaggregated cost outcomes.
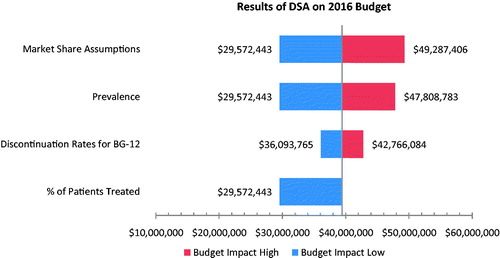
Figure 2. Results of the deterministic sensitivity analysis on the 2016 budget. All costs reported in 2013 Canadian dollars.