Figures & data
Table 1. Acute treatment studies characteristics.
Figure 1. Model diagram. CRNMBE, clinically relevant non-major bleeds; CTEPH, chronic thromboembolic pulmonary hypertension; ICH, intracranial hemorrhage; iDVT, index DVT; iPE, index PE; iVTE, index VTE; MBE, major bleeds; PTS, post-thrombotic syndrome; rDVT, recurrent DVT; rPE, recurrent PE; rVTE, recurrent VTE.
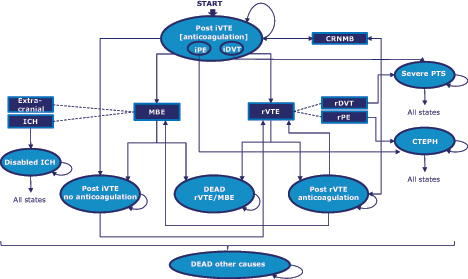
Table 2. Unit costs and resource use inputs, £(2014).
Table 3. Indirect comparison results—RE-COVER I, II, and EINSTEIN studies.
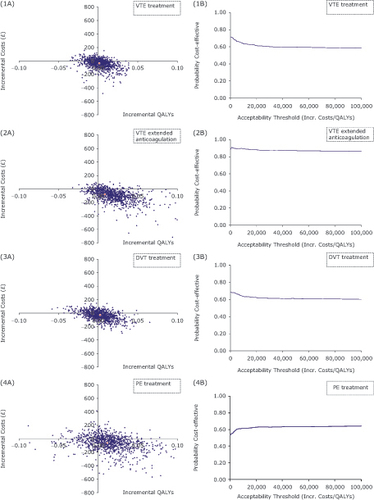
Figure 2. Probabilistic sensitivity analyses results. (1a, b) CE plane and CEAC VTE (DVT/PE) treatment; (2a, b) CE plane and CEAC VTE extended anticoagulation; (3a, b) CE plane and CEAC index DVT treatment; (4a, b) CE plane and CEAC index PE treatment; CE, cost-effectiveness; CEAC, cost-effectiveness acceptability curve; DVT, deep vein thrombosis; IC, incremental costs; Incr., incremental; PE, pulmonary embolism; QALY, quality-adjusted life years; VTE, venous thromboembolism.