Figures & data
Figure 1. Distribution of PwMS by gender across EDSS categories.
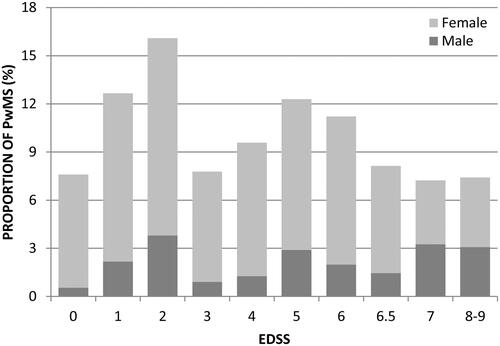
Table 1. Sample demographics and disease characteristics (n = 553).
Figure 2. Total mean annual cost per PwMS.
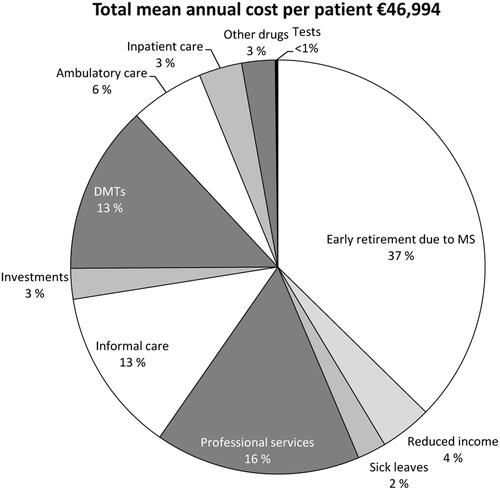
Table 2. Use of medical resources and estimated direct healthcare costs.
Table 3. Use of investments and services and estimated direct non-medical costs.
Figure 3. Effect of MS on working capacity: proportion (%) of PwMS below age of 63 of all patients in each EDSS category (bars) and proportion (%) of PwMS on disability pension due to MS of those below age of 63 (line).
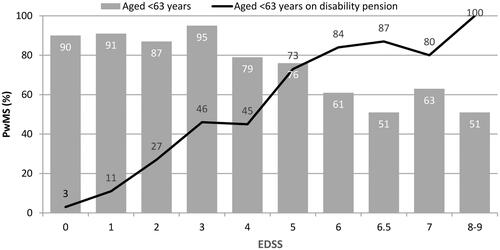
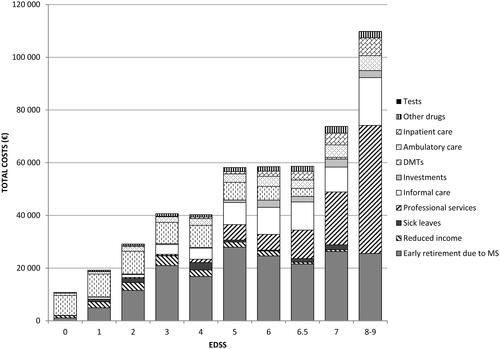
Figure 4. Distribution of total annual costs across different resources.