Figures & data
Figure 1. Structure of decision tree model of posaconazole vs fluconazole or itraconazole for the prevention of IFD among a high-risk neutropenic population.
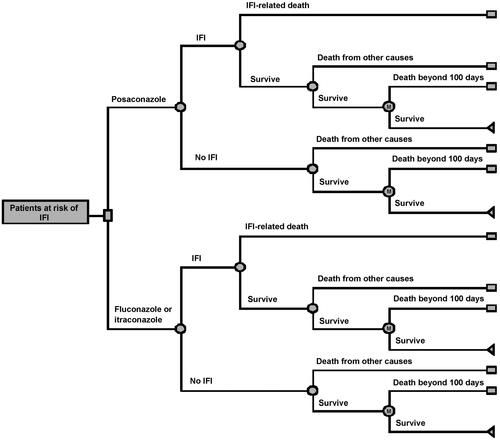
Table 1. Model parameters adopted.
Table 2. Cost-effectiveness of posaconazole vs fluconazole/itraconazole in the prevention of invasive fungal diseases (IFD) among high-risk neutropenic patients based on two scenarios.
Figure 2. Scatter-plot of 1000 incremental cost and incremental life-year pairs for posaconazole vs fluconazole or itraconazole according to scenario 1, which assumed that there was no difference in mortality associated with IFD in different prophylactic groups. PSA, probabilistic sensitivity analysis; ICER, incremental cost-effectiveness ratio; LYS, life-years saved.
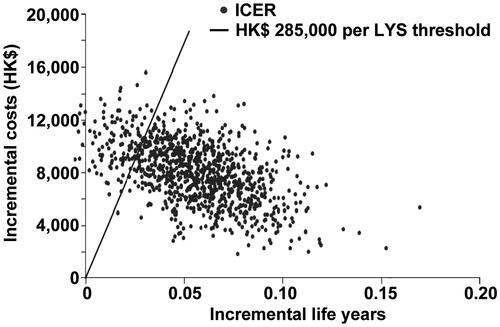
Figure 3. Scatter-plot of 1000 incremental cost and incremental life-year pairs for posaconazole vs fluconazole or itraconazole according to scenario 2, which assumed that there was a lower mortality associated with IFD in the posaconazole group as compared with the fluconazole/itraconazole group, according to published resultsCitation9. PSA, probabilistic sensitivity analysis; ICER, incremental cost-effectiveness ratio; LYS, life-years saved.
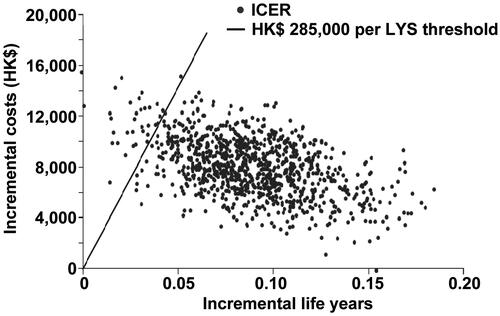
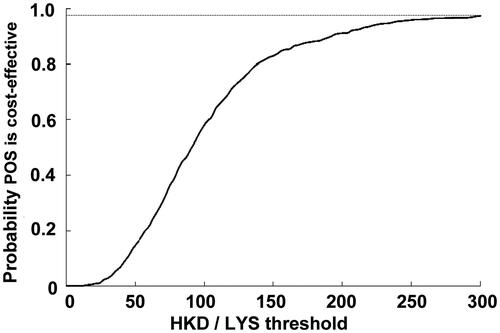
Figure 4. Probablitiy that posaconazole was cost-effective vs fluconazole or itraconazole for the prevention of IFD according to scenario 1, which assumed that there was no difference in mortality associated with IFD in different prophylactic groups. CEAC, cost-effectiveness acceptability curve; LYS, life-years saved; POS, posaconazole.
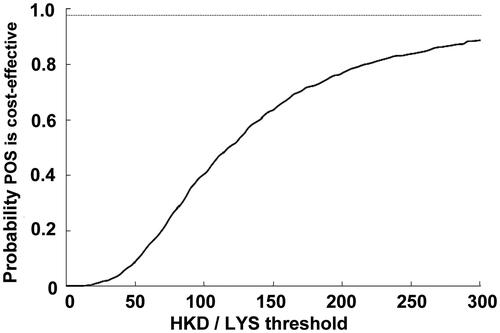
Figure 5. Probability that posaconazole was cost-effective vs fluconazole or itraconazole for the prevention of IFD according to scenario 2, which assumed that there was a lower mortality associated with IFD in the posaconazole group as compared with the fluconazole/itraconazole group, according to published resultsCitation9. CEAC, cost-effectiveness acceptability curve; LYS, life-years saved; POS, posaconazole.