Figures & data
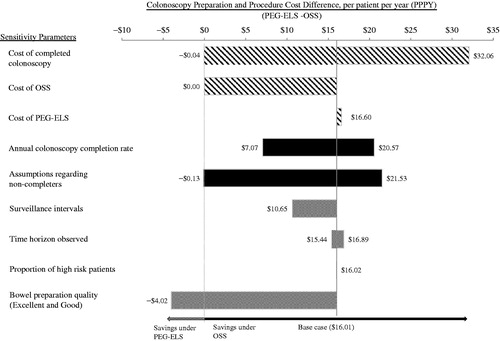
Figure 1. Model flow diagram for simulation cohort.
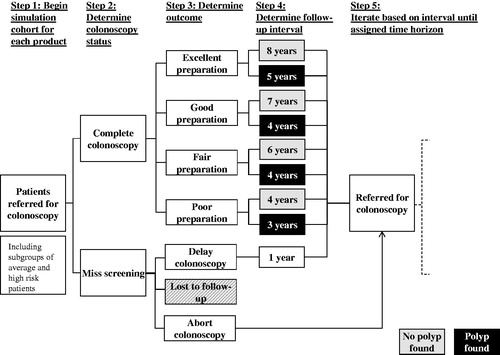
Figure 2. Model flow diagram illustrating cost difference calculation for a single colonoscopy cycle. The cost difference in colonoscopy screening for a single colonoscopy cycle is illustrated in the schematic model. The cumulative cost difference in colonoscopy screenings over the time horizon accounts for varying recommended post-colonoscopy intervals, which are determined by colonoscopy cleansing score and polyp detection for each colonoscopy cycle.
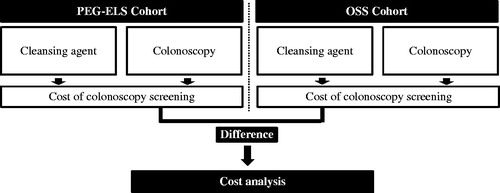
Table 1. Summary of inputs for one-way sensitivity analyses.
Figure 3. Cumulative colonoscopy cost.
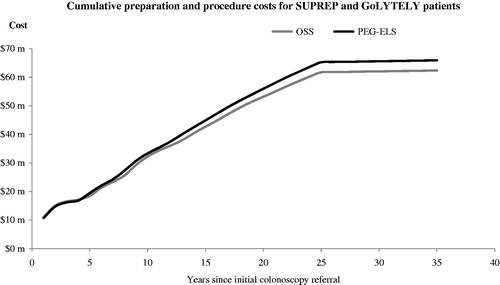
Figure 4. Comparison of cost components associated with OSS use. Compares the cost differences between OSS and PEG-ELS for cleansing agent cost and colonoscopy procedure cost separately. The cost differences between OSS and PEG-ELS are observed as early as 5 years. Over the time horizon, the cost model shows that the cost savings for OSS increase more rapidly than additional costs incurred in the years after colonoscopy referral.
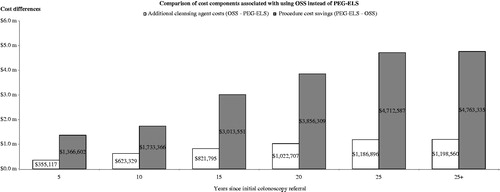
Figure 5. Univariate sensitivity analysis, tornado diagram. Illustrates the robustness of the cost model under different assumptions about costs (procedure and cleansing agent), rate of colonoscopy completion, and other inputs (i.e., average surveillance intervals, time horizon observed, and proportion of high risk patients). Positive cost difference means that cost savings were observed for the OSS cohort and negative cost difference means that cost savings were observed for the PEG-ELS cohort.