Figures & data
Table 1. Description of variable in Probit regression models.
Figure 1. Cure rate of different tumors in different expense groups.
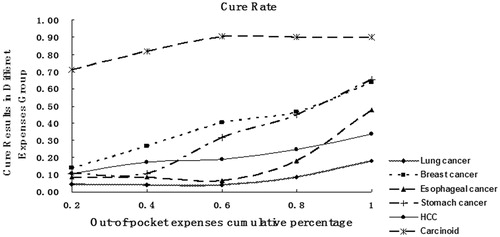
Figure 2. Uncured rate of different tumors in different expense groups.
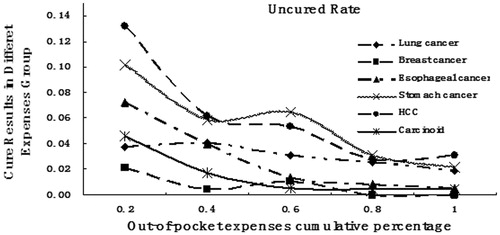
Table 2. Concentration index and horizontal inequity index in treatment result.
Table 3. Decomposition of inequality in cure rate and uncured rate.
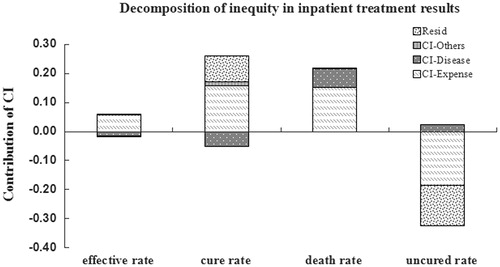
Figure 3. Decomposition of inequity in inpatient treatment results.
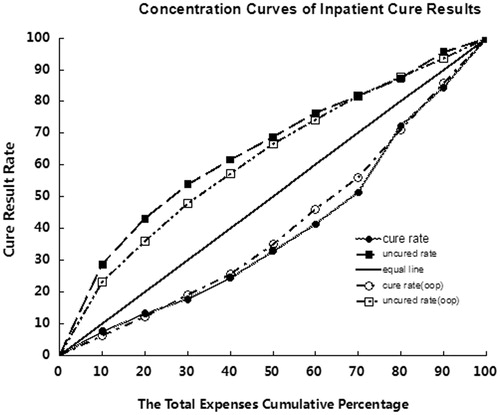
Figure 4. Concentration curves of inpatient cure results.