Figures & data
Figure 1. Patient Attrition. *ICD-9-CM codes included: 203.00, 203.01, 203.02. †Excluding non-melanoma skin cancer. ‡Patients matched at index date of MM patients based on age, gender, geographic location, insurance type, baseline Charlson/Deyo comorbidity index comorbidity score, and follow-up time. See methods for additional information. §The results presented here were part of a broader analysis of patients with MM that utilized a control group of patients without MM. For the purposes of this current analysis and report, results for MM patients relative to the control group are not included. MM, multiple myeloma; N, number of patients.
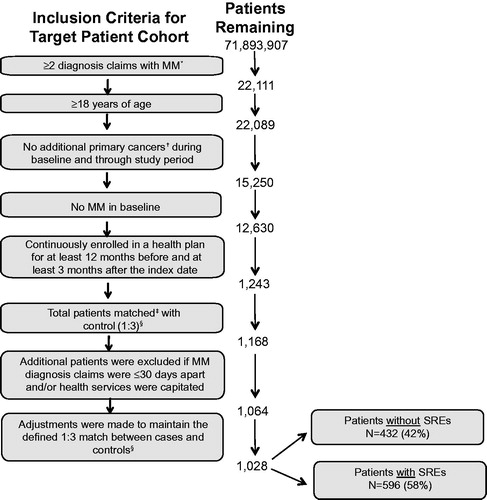
Table 1. Patient characteristics.
Figure 2. Frequencies of SREs and bisphosphonate use in mutiple myeloma patients. *Eighty-eight patients had an SRE at the index date. †Thirty-five patients used a bisphosphonate before their first SRE. ‡Thirty-seven patients had four SREs, 19 had five SREs, and 22 had ≥6 SREs. Bisphosphonates included pamidronate, zoledronic acid, risedronate, alendronate, ibandronate, etidronate, and tiludronate. MM, multiple myeloma; SRE, skeletal-related event.
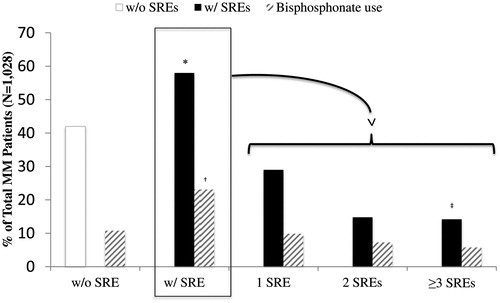
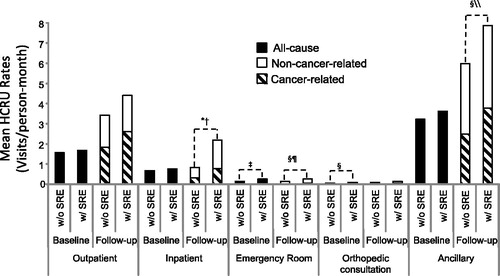
Figure 3. PS-adjusted rates of healthcare resource utilization among multiple myeloma patients. Standard error was estimated by 1000 bootstrapping replication; p-values for comparison were generated utilizing 2-sample t-tests. All-cause HCRU is comprised of cancer- and non-cancer-related HCRU. *p < 0.0001 (PS-Adjusted, All-cause: with SRE vs without SRE). †p < 0.0001 (PS-Adjusted, Cancer-related: with SRE vs without SRE). ‡p < 0.001 (PS-Adjusted, All-cause: with SRE vs without SRE). §p < 0.01 (PS-Adjusted, All-cause: with SRE vs without SRE). ¶p < 0.05 (PS-Adjusted, Cancer-related: with SRE vs without SRE). \\p ≤ 0.001 (PS-Adjusted, Cancer-related: with SRE vs without SRE). HCRU, healthcare resource use; MM, multiple myeloma; PS, Propensity score; SRE, skeletal-related events; w/, with; w/o, without.