
Figures & data
Table 1. Demographic characteristics of newly-diagnosed type 2 diabetes mellitus populations, 2007 vs 2012.
Figure 1. Overall distribution of drug prescriptions among newly-diagnosed patients, 2007 and 2012. GLP1, glucagon-like peptide-1 agonist; OAD, oral anti-diabetic drug.
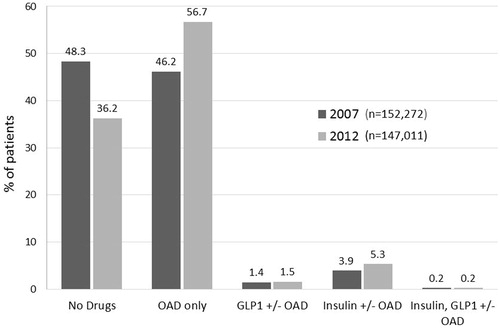
Table 2. Distribution of drug classes prescribed for patients with newly-diagnosed type 2 diabetes mellitus, 2007 vs 2012.
Figure 2. Distribution of OAD use by number of different OADs represented in claims among newly-diagnosed patients, 2007 and 2012. OAD, oral anti-diabetic drug. Percentages reflect the proportion of patients within the category. Percentages for patients using four or more OADs are not reflected graphically: OADs only, 2007 (0.6%), 2012 (0.2%); Insulin + OADs, 2007 (1.0%), 2012 (0.7%).
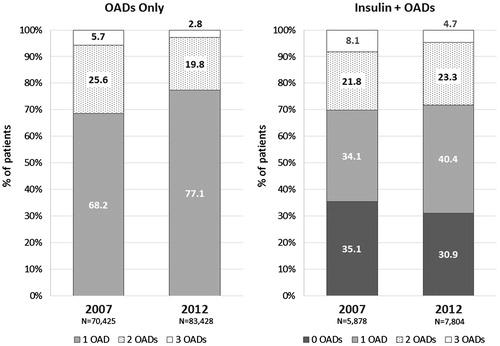
Figure 3. Distribution of OAD use by specific drugs/classes among newly-diagnosed type 2 diabetes mellitus patients using (a) OADs only or (b) insulin plus OADs, 2007 vs 2012. DPP-IV, dipeptidyl peptidase-4 inhibitor; MET, metformin; OAD, oral anti-diabetic drug; SU, sulfonylurea; TZD, thiazolidinedione. Percentages reflect the proportion of patients within the category. Percentages for patients using ‘Other’ OADs are not reflected graphically: 1 ‘Other’ OAD only, 2007 (3.9%), 2012 (2.4%); 2 ‘Other’ OADs only (for ‘Other’ OAD combinations), 2007 (4.0%), 2012 (3.3%); Insulin + 1 ‘Other’ OAD only, 2007 (6.0%), 2012 (5.9%); Insulin + 2 ‘Other’ OADs, 2007 (7.4%), 2012 (5.8%).
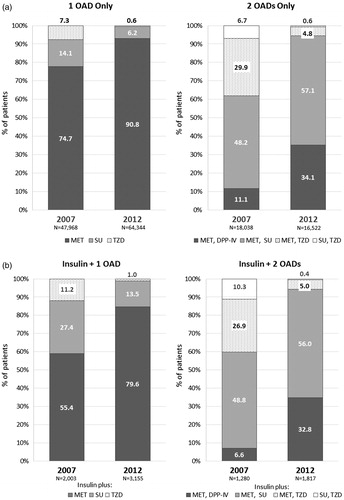
Table 3. Prescription claim detail for all newly-diagnosed type 2 diabetes mellitus patients, 2007 and 2012.
Table 4. Annual healthcare costs per patient with newly-diagnosed type 2 diabetes mellitus, 2007 vs 2012.
Table 5. Inpatient and outpatient utilization patterns and cost details, 2007 vs 2012.