
Figures & data
Table 1. General model assumptions.
Table 2. Average resource use for treatment of a patient with HDM RAD.
Table 3. Unit costs (€).
Table 4. Cost of treatments for HDM RAD with SQ SLIT-tablet and SQ SCIT (€).
Figure 1. Relationship between number of patients treated, potential treatment cost savings and potential additional patients treated, HDM RAD. PV, present value.
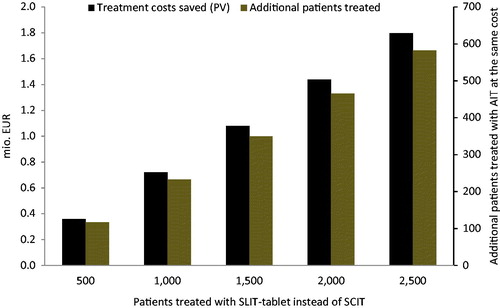
Table 5. Univariate sensitivity analysis for HDM RAD (direct treatment costs in €).