Figures & data
Table 1. Emission factors for crop types (g/kg)
Table 2. Range of emission factor values for crop types (g/kg)
Table 3. Error range of emission factor values for crop types (g/kg)
Table 4. Annual carbon and air quality emissions from crop residue burning by state averaged over the years 2003–2007
Figure 1. Average annual CO emissions (Gg) from crop residue burning by county for the CONUS (projection: Albers Equal Area Conic).
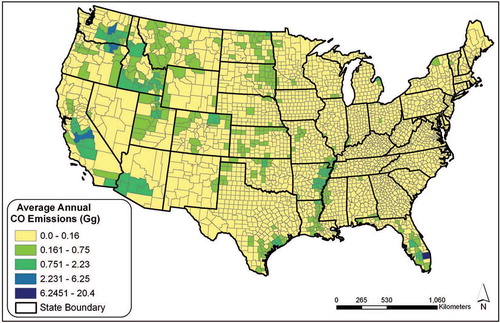
Figure 2. Average annual PM2.5 emissions (Gg) from crop residue burning by county for the CONUS (projection: Albers Equal Area Conic).
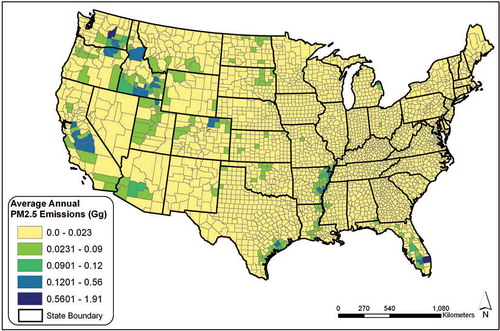
Figure 3. Source counties of crop residue burning emissions. Cities contained within and/or contiguous to these source counties are labeled (projection: Albers Equal Area Conic).
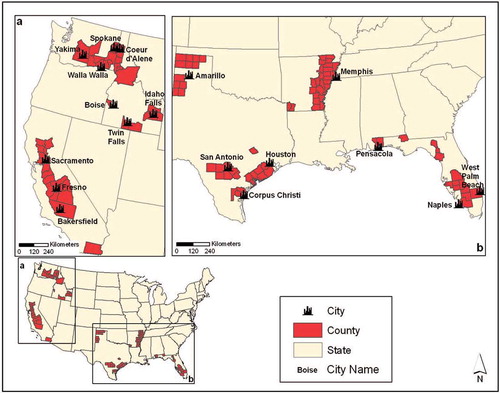
Figure 4. EPA source regions of crop residue burning emissions (projection: Albers Equal Area Conic).
Figure 5. Monthly distribution of average CO emissions from crop residue burning by EPA source region for years 2003–2007.
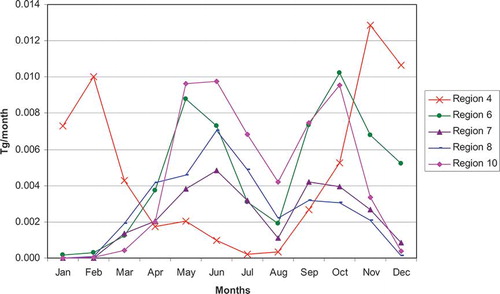
Figure 6. Average contribution of emissions by crop type for the EPA source regions for years 2003–2007.