Figures & data
Figure 1. Maps of May-to-September 2002 total biogenic emissions for MEGAN and BEIS: (a) isoprene MEGAN, (b) isoprene BEIS, (c) monoterpenes MEGAN, (d) monoterpenes BEIS, (e) sesquiterpenes MEGAN, (f) sesquiterpenes BEIS, (g) NO MEGAN, and (h) NO BEIS. NO emissions are expressed in Mmols; all others are expressed in Mmols carbon.
Figure 2. Time series of domain total biogenic emissions for MEGAN and BEIS for May to September 2002 for (a) isoprene, (b) monoterpenes, (c) sesquiterpenes, and (d) NO. NO emissions are expressed in Mmols; all others are expressed in Mmols carbon.
Table 1. Summary of anthropogenic and total emissions
Table 2. List of model simulations analyzed in this study
Figure 3. (a) Boxplots illustrating the diurnal distributions of observed and BASE-MEGAN simulated hourly isoprene concentrations. For each hour of the day, the boxes represent the range between the 25th and 75th percentile of all concentration values for that hour across the May 15 to September 30 analysis period and the 29 hourly isoprene monitors in the modeling domain, whereas lines indicate the median values. (b) Same as in panel a but for observations and BASE-BEIS.
Table 3. Model performance statistics for DM8H ozone concentrations across 601 monitors for May 15 to September 30, 2002
Figure 4. Maps of seasonal average DM8A ozone concentrations from the four model simulations and their differences: (a) BASE-MEGAN, (b) CTRL-MEGAN, (c) BASE-BEIS, (d) CTRL-BEIS, (e) BASE-MEGAN minus BASE-BEIS, and (f) CTRL-MEGAN minus CTRL-BEIS. All concentrations were averaged for May 15 to September 30, 2002 and are shown in ppb.
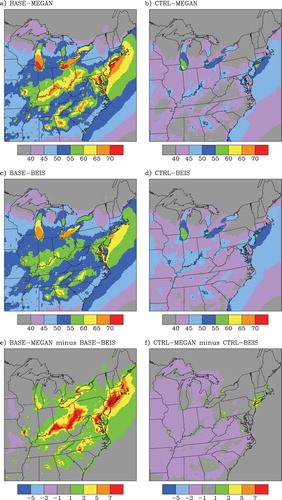
Figure 5. Maps of the H2O2/HNO3 indicator ratio for the four model simulations. (a) BASE-MEGAN, (b) BASE-BEIS, (c) CTRL-MEGAN, and (d), CTRL-BEIS. The indicator ratio was computed from average 12:00 to 5:00 p.m. concentrations for May 15 to September 30, 2002.
Figure 6. Maps of the dimensionless RRF for DM8A ozone calculated for the MEGAN and BEIS platforms using the BASE and CTRL emission scenarios: (a) RRF for the MEGAN platform, (b) RRF for the BEIS platform, and (c) RRF for the MEGAN platform minus RRF for the BEIS platform. Areas in white represent grid cells for which no RRF could be computed because the minimum selection criteria specified in the guidance documentCitation34 were not satisfied.
Table 4. Summary of results from previous studies investigating the impacts of changes in various components of the overall modeling system on estimates of RRFs for DM8H ozone
Figure 7. Seasonal average concentrations of various biogenic SOA components for BASE-MEGAN, BASE-BEIS, CTRL-MEGAN, and CTRL-BEIS as well as the differences between the MEGAN and BEIS simulations for the BASE and CTRL emission scenarios. For these bar charts, the concentrations were averaged over all nonwater grid cells. This figure presents the concentrations from the five pathways for the formation of biogenic SOA in CMAQ version 4.7 as described in Napelenok et al.,Citation56 Foley et al.,Citation48 and Carlton et al.Citation57; namely, the 2-product formation pathway from ISOP1, the acid-catalyzed formation from ISOP2, the formation pathways from the oxidation of MONO and SESQ, and the oligomerization of aged particles from all OLIG.
Figure 8. Maps of seasonal average biogenic SOA concentrations from the four model simulations and their differences: (a) BASE-MEGAN, (b) CTRL-MEGAN, (c) BASE-BEIS, (d) CTRL-BEIS, (e) BASE-MEGAN minus BASE-BEIS, and (f) CTRL-MEGAN minus CTRL-BEIS. All concentrations were averaged for May 15 to September 30, 2002 and are shown in units of μg/m3.
Figure 9. Maps of seasonal average total organic aerosol concentrations from the four model simulations and their differences: (a) BASE-MEGAN, (b) CTRL-MEGAN, (c) BASE-BEIS, (d) CTRL-BEIS, (e) BASE-MEGAN minus BASE-BEIS, and (f) CTRL-MEGAN minus CTRL-BEIS. All concentrations were averaged for May 15 to September 30, 2002 and are shown in units of μg/m3.
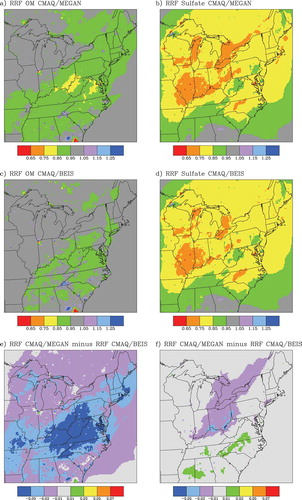
Figure 10. Maps of the dimensionless RRF for May-to-September average total organic aerosol mass and sulfate (SO4) concentrations calculated for the MEGAN and BEIS platforms using the BASE and CTRL emission scenarios: (a) OM RRF for the MEGAN platform, (b) SO4 RRF for the MEGAN platform, (c) OM RRF for the BEIS platform, (d) SO4 RRF for the BEIS platform, (e) OM RRF for the MEGAN platform minus OM RRF for the BEIS platform, and (f) SO4 RRF for the MEGAN platform minus SO4 RRF for the BEIS platform.