Figures & data
Figure 1. Upstream and downstream stages of the TFC for conventional and alternative fuels.
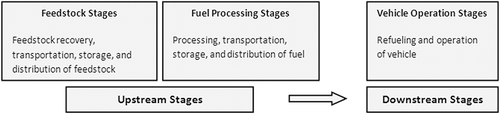
Figure 2. Six fuel pathways analyzed for the HDV sector.
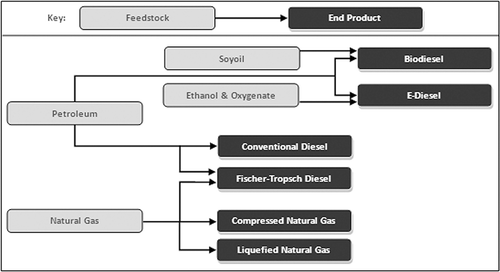
Table 1. Fuel specifications
Table 3. Results from HDV TFC analysis for energy use, petroleum consumption, and select emissions
Table 2. HDV WTP energy consumption and emissions (reported in Btu/MBtu or g/MBtu of fuel available at fuel station pumps) with ratios of alternative fuel values to ULSD values shown in parentheses
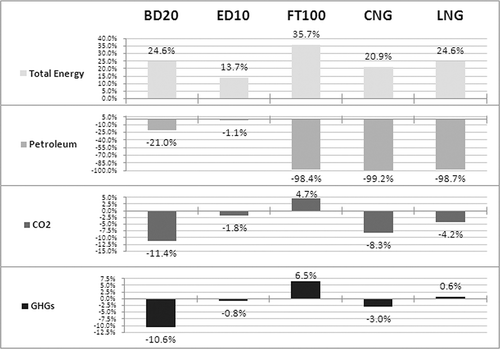
Figure 3. TFC percent change vs. ULSD HDV: (a) total energy, (b) petroleum, (c) CO2, and (d) GHGs.