Figures & data
Figure 1. Location of the CALMET/CALPUFF meteorological modeling domain (hatched area).
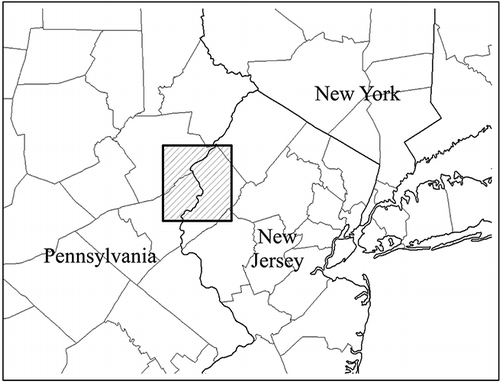
Figure 2. Location of SO2 sources, monitors, and meteorological stations used in the model validation study.
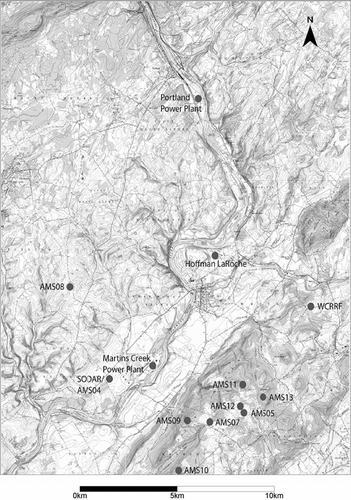
Figure 3. Photo of the Portland Power Plant in the foreground and the Martins Creek Power Plant in the background.
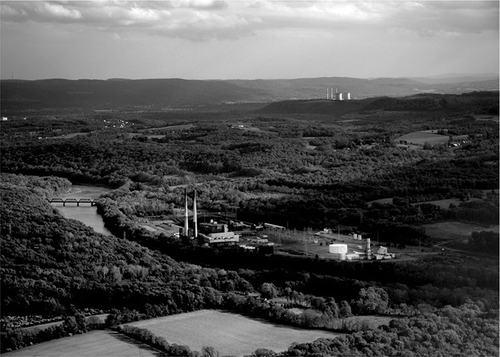
Table 1. Source characteristics and SO2 emissions
Figure 4. Wind roses from meteorological data collected May 1, 1992 to May 19, 1993: (a) 10-m AMS-4, (b) 150-m AMS-4, (c) 300-m AMS-4, and (d) 10-m AMS-8.
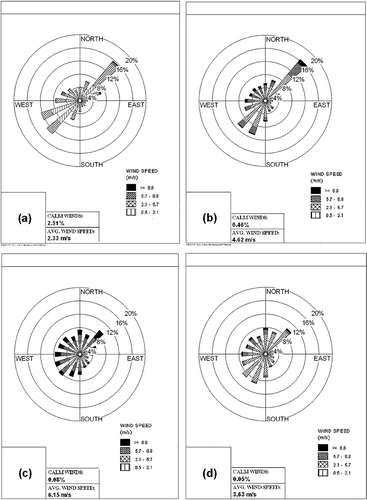
Table 2. Modeled high and second-high impact compared with network-wide observed high and second-high concentration
Figure 5. Calculation of the AMS-8 24-hr RHC with various values of N.
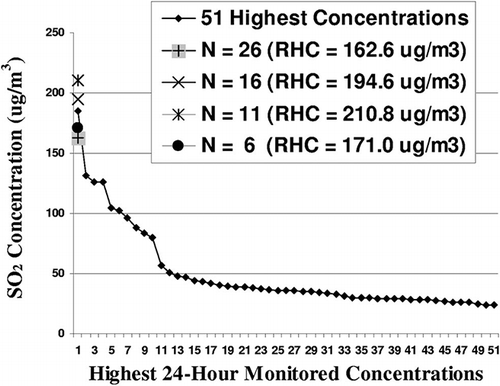
Table 3. Modeled RHC compared with network-wide observed RHC
Figure 6. Q-Q plots of CALPUFF and AERMOD predicted concentrations and observed concentrations.
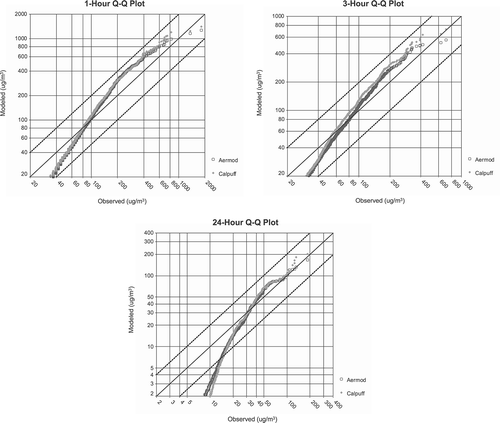
Table 4. Individual monitor's modeled RHC compared with the observed RHC
Table 5. One-hour observed RHC compared with modeled RHC as a function of atmospheric stability
Table 6. Summary of BOOT performance measures for 1-hr observed and modeled concentrations
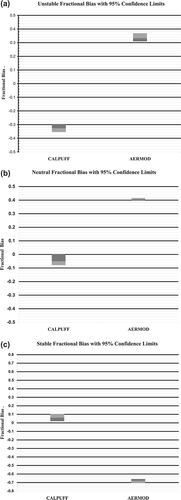
Figure 7. One-hour FB confidence limits as a function of atmospheric stability: (a) unstable, (b) neutral, and (c) stable.