Figures & data
Figure 1. The location of air monitoring sites at local commercial, industrial, and mobile source-dominated sites in Paterson (information from NJDEP). The prevailing wind directions (northwestern for winter and spring seasons and southwest for summer and fall seasons) were obtained from meteorological data monitored at the Teterboro Airport weather station and are displayed as red arrows in the figure.
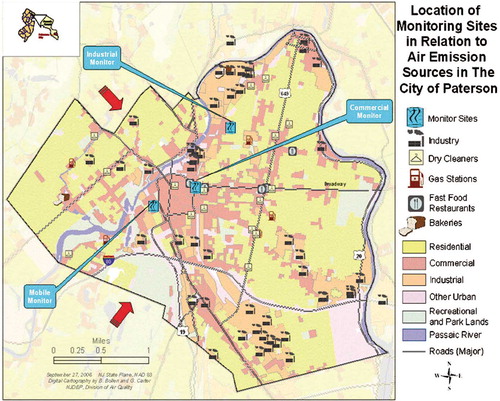
Table 1. Descriptive statistics for EC, OC, PM10, and 48 trace elements in PM10 for the study
Table 2. The summary of meteorological data reported in the two nearby airports for the sampling locations in Paterson and Chester
Table 3. Descriptive statistics and spatial differences among the four sampling sites in the study
Figure 2. Seasonal variation (mean ± standard error [SE]) of (a) EC, (b) OC, (c) PM10, (d) Ca, (e) Cu, (f) Fe, (g) Pb, (h) Mn, (i) Ni, (j) S, (k) Ti, and (l) Zn at each sampling site.
![Figure 2. Seasonal variation (mean ± standard error [SE]) of (a) EC, (b) OC, (c) PM10, (d) Ca, (e) Cu, (f) Fe, (g) Pb, (h) Mn, (i) Ni, (j) S, (k) Ti, and (l) Zn at each sampling site.](/cms/asset/fc530efa-b255-4ed8-a9e9-2b56cd4c086d/uawm_a_10412132_o_f0002g.gif)
Figure 3. The ratios of weekday/weekend mean concentration by each sampling site. The dotted reference line (1.0) indicates the equivalent mean concentration for weekday and weekend measurements.
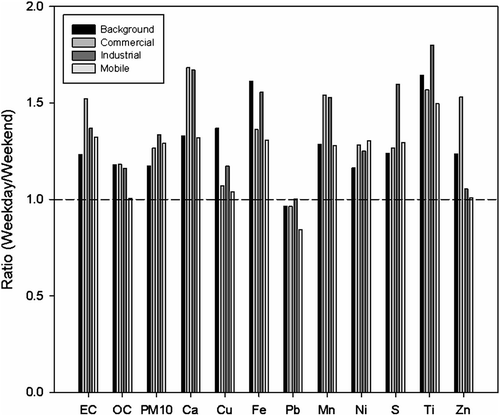
Table 4. Spearman correlation coefficients among EC, OC, and trace elements in PM10 by each monitoring site
Table 5. Factors identified by dominant species and temporal patterns using an EPA PMF model
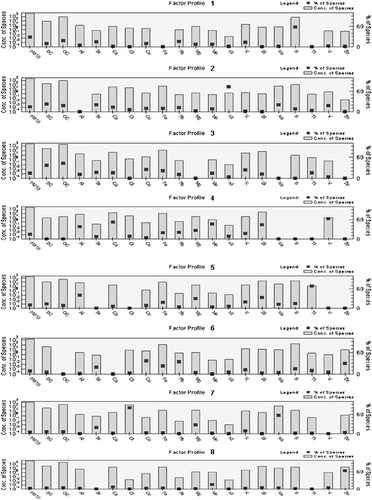
Figure 4. The source profiles plotted as concentration and percent contribution vs. chemical species.