Figures & data
Figure 1. PAQS artifact-corrected OC calculated as Q – QQB (□) and Q – TQB (Δ) and from the denuder sampler (Equationeq 5). Adapted with permission from Subramanian et al.Citation5 First published in Aerosol Science and Technology, 38 (suppl 1), 27-48, 2004. Copyright 2004 Taylor & Francis, Aerosol Science and Technology.
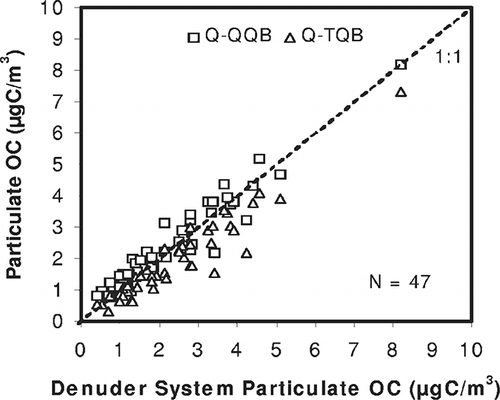
Figure 2. (a) Dynamic blank sampler and (b) denuder system configurations used to estimate OC artifact during PAQS. Filters are labeled as follows: Q = QFF, T = Teflon filter, QQB = quartz quartz backup, TQB, Teflon quartz backup, ADS = CIG adsorbent.
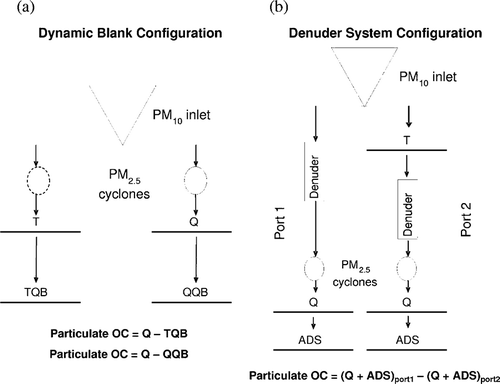
Table 1. OC measurements during the PAQS, the RIOPA study, and the six-site STN/IMPROVE comparison study
Table 2a. PAQS artifacts. Regression of measured QFF OC concentration (μgC/m3) on PM2.5 (μg/m3) mass by standard LLSR, Deming regression (accounting for measurement uncertainties), and LLSR and Deming regression after outlier removal by robust regression for PAQS
Table 2b. RIOPA artifacts. Regression of measured QFF OC concentration (μgC/m3) on PM2.5 (μg/m3) mass by standard LLSR, Deming regression (accounting for measurement uncertainties), and LLSR and Deming regression after outlier removal by robust regression for RIOPA sites
Table 2c. Six-site STN/IMPROVE comparison study. Regression of measured QFF OC concentration (μgC/m3) on PM2.5 (μg/m3) mass by standard LLSR, Deming regression (accounting for measurement uncertainties), and LLSR and Deming regression after outlier removal by robust regression
Table 3. OC estimates by denuder (Equationeq 5), by backup filter subtraction (Q-TQB and Q-QQB), by RM (Deming robust regression), and uncorrected front QFF OC for PAQS and RIOPA
Figure 3. Measured front QFF OC (μgC/m3) and PM2.5 mass (μg/m3) for (a) PAQS, (b–d) RIOPA sites, and (e–j) the six-site STN/IMPROVE comparison study. Dashed circles are outliers in x or y identified by robust regression. The solid line is the Deming linear regression of y on x performed without outliers. The RM estimate is the Deming regression y-intercept value after outlier removal by the robust regression (). The dashed line is the RM artifact estimate (y-intercept of regression; see also ). In the RM, this value is subtracted from each sample. Note OC concentrations that fall below this line will be negative after RM artifact correction. Dashed squares indicate points not identified as outliers but with a large influence on the regression.
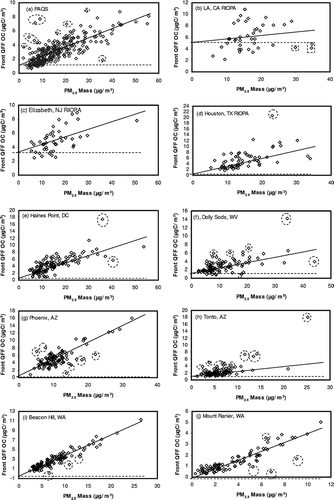
Figure 4. Measured organic adsorption artifact OC (TQB or QQB) and front-filter OC for (a) PAQS and (b–d) RIOPA sites. The increase in measured organic adsorption artifact with increasing front-filter OC (a measure of the organic pollution level) was significant (linear regression t test, α= 0.05) for PAQS and RIOPA sites. An increase in the actual organic adsorption artifact with organic pollution level violates an assumption of the RM of organic artifact estimation.
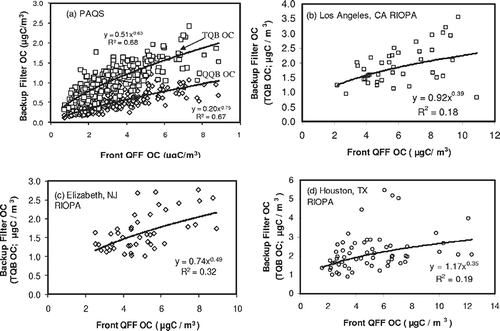
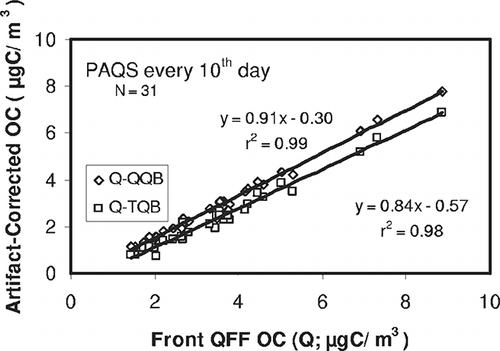
Figure 5. LLSR of artifact-corrected OC (Q – QQB or Q – TQB; y-axis) on front QFF OC (measured on Q; x-axis), demonstrating intermittent backup filter collection with every tenth sample for PAQS. The regression lines shown correspond well with their full dataset equivalents (PAQS Q – QQB: y = 0.89x – 0.14, r2 = 0.99; PAQS Q – TQB: y = 0.81x – 0.43, r2 = 0.97; N = 301). For days without backup filter measurements, particulate OC can be estimated from regression equations such as these.