Figures & data
Figure 1. Locations of (a) the YRDR and (b) its 20 sites. Area in the small box of panel a is the YRDR.
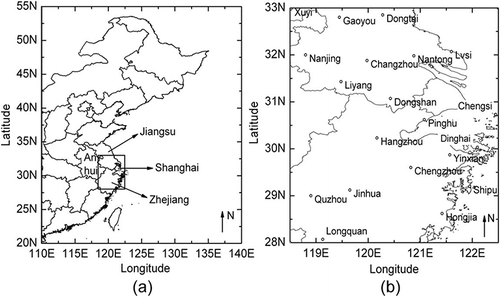
Table 1. The worst 20% and 50% and best 20% 25-yr average VR and their rates in the YRDR
Figure 2. The worst 20% and 50% and best 20% domain-average VR trends of the YRDR. Dashed lines are the linear regression curves of the corresponding trend lines.
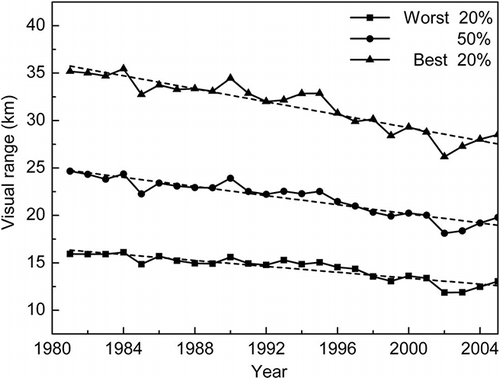
Figure 3. Spatial distribution of the 5-yr average median (i.e., 50%) VR (in km): (a) the first 5 yr (i.e., from 1981 to 1985) and (b) the last 5 yr (i.e., from 2001 to 2005). The interpolation error created by sparse sites in southwestern Liyang and the coastal and southeastern regions of Longquan should be considered in analysis.
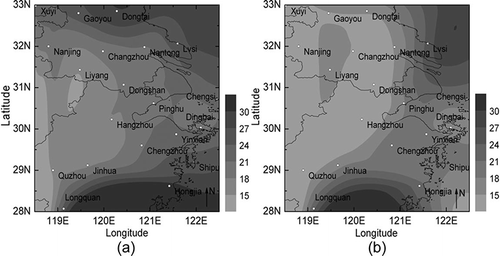
Figure 4. Ridit plot for Nanjing, Hangzhou, and Lvsi. A mean ridit value of 0.5 means there is no difference with respect to the reference distribution, whereas a ridit value <0.5 means lower VR and >0.5 means better VR.
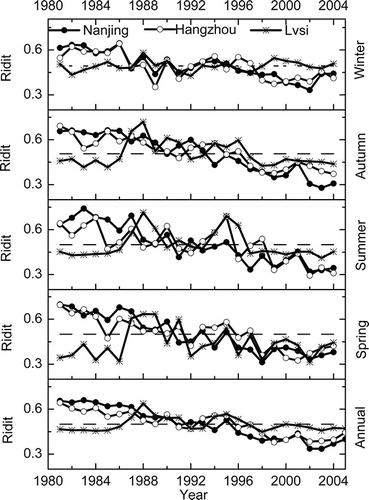
Figure 5. Five-year averaged VR of the (a) worst 20%, (b) 50% (median), and (c) best 20% at Nanjing, Hangzhou, and Lvsi.
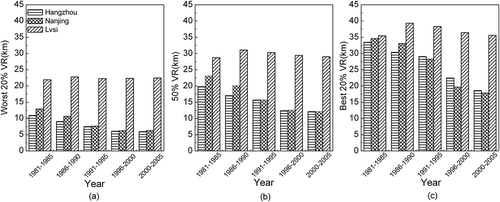
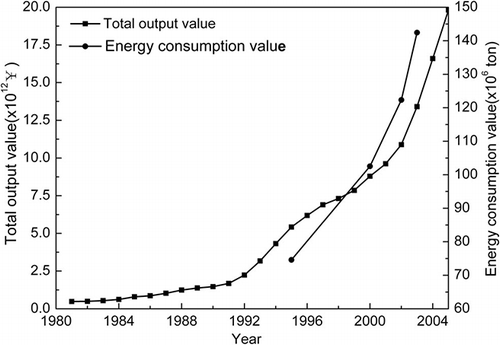
Figure 6. Total industrial output values of Jiangsu, Shanghai, and Zhejiang and energy consumption values in industrial enterprises of Jiangsu.