Objective markers of drug effects on brain function from recordings of scalp potential in healthy volunteers
Marcadores objetivos del efecto de fármacos en la función cerebral a partir del registro de la actividad eléctrica del cuero cabelludo en voluntarios sanos
Les marqueurs objectifs des effets médicamenteux sur la fonction cérébrale à partir d'enregistrements de l'activité électrique sur le cuir chevelu de volontaires sains
Peter H. BoeijingaHead of MEG and Clinical EEG Explorations, FORENAP, Institute for Research in Neuroscience and Neuropsychiatry, Rouffach, FranceCorrespondence[email protected]
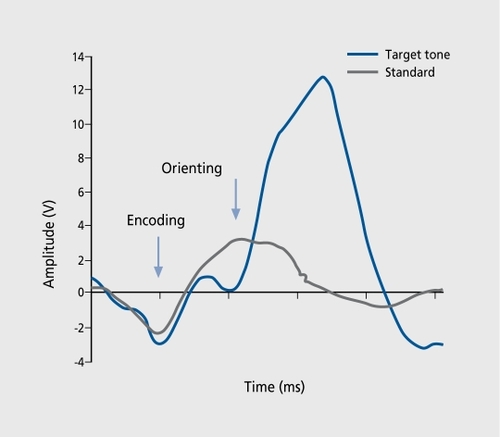
Figure 1. Example of an averaged P300 response. The methods for event-related potential (ERP) recordings are described elsewhere.Citation1 In brief, 28 electroencephalography (EEG) leads were recorded using an ear-linked reference. Subjects listened to a series of two tones, presented binaurally, with a frequency of 500 Hz for frequent tones and 2000 Hz for infrequent tones, in a soundproof and electrically shielded room; they were asked to keep their eyes closed and to count the infrequent tones silently. Sampling rate was 250 samples per second with filter settings at 0.5 to 70 Hz (24 dB/oct). The average amplitude between 230 and 352 ms is calculated to yield areas under the response curves (P3 surface) for each individual subject and time point.
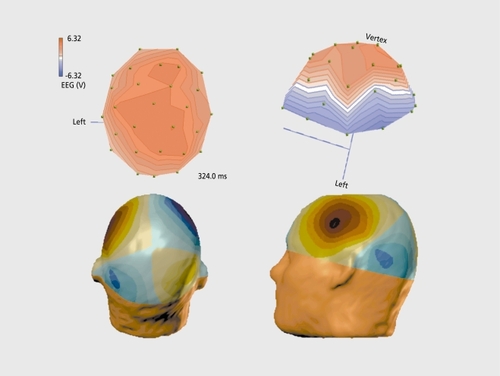
Figure 2. Topographic distribution of P300 responses. Top: electrical activity from scalp electrodes top view (left) and lateral view (right) of the left surface with the nose pointing toward the left. Bottom: the same as above, but for the magnetic measurement at several millimeters from the scalp. EEG, electroencephalography.
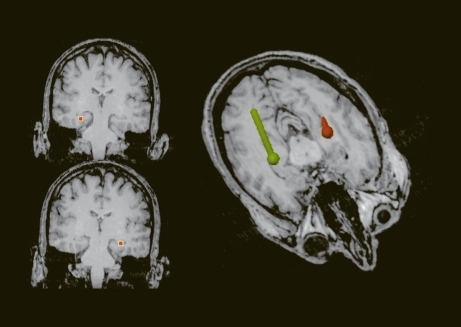
Figure 3. Limbic sources of P300m dipoles. Three-dimensional reconstruction of the major sources explaining the pattern presented in Figure 2. Note the location in the posterior part of the hippocampal formation.
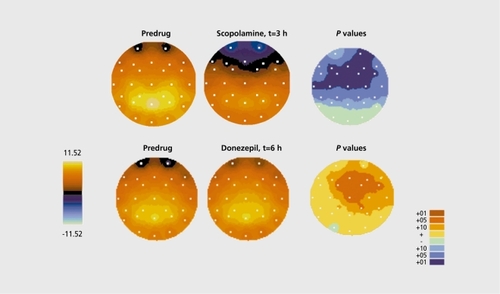
Figure 4. Cholinergic control of P300 in young healthy volunteers. Top: Mapping result show the dramatic deterioration under scopolamine (0.5 mg, subcutaneous). Pvalues are issued after multiple nonparametric comparisons (Wilcoxon) between two experimental conditions for each electrode with significance levels coded in the rainbow scale at the lower right-hand side. (Increase in red; decrease in blue, for details the reader is referred Statistical Decision Tree or SDT25.) Bottom: Postdosing mapping of donepezil (5 mg) yields enhancement of P300 responses.
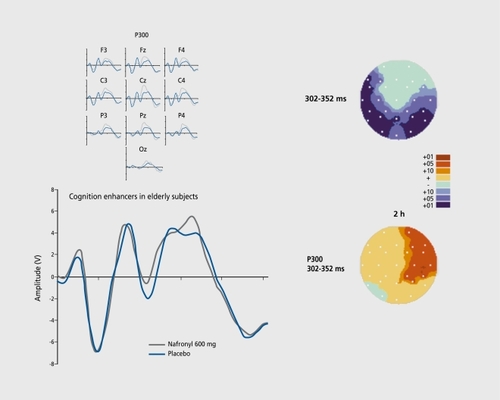
Figure 5. Age-related modifications in P300. Top left: Average curves for elderly (aged >55 years; blue lines) and young volunteers (gray lines) for several scalp positions. Top right: Statistical comparison between elderly and young subjects. Bottom left: Average cun/es in untreated (placebo) and treated elderly male volunteers. Bottom right: Statistical comparison showing significant improvement.
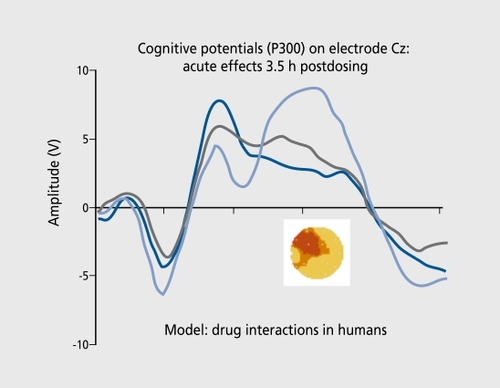
Figure 6. Superimposed average P300 responses for baseline conditions (light-blue lines) and after a drug challenge (dark-blue lines). The effect of an acetylcholinesterase (AchE) inhibitor (gray lines) restores the deteriorated signal in the direction of baseline levels. Inset: statistical mapping of treatment drug 2 + drug 1 versus drug 1 alone. Scaling as in Figure 4.
Liogier d'ArdhuyX.BoeijingaPH.RenaultB.et al.Effects of serotoninselective and classical antidepressants on the auditory P300 cognitive potential.Neuropsychobiology.19994020721310559704